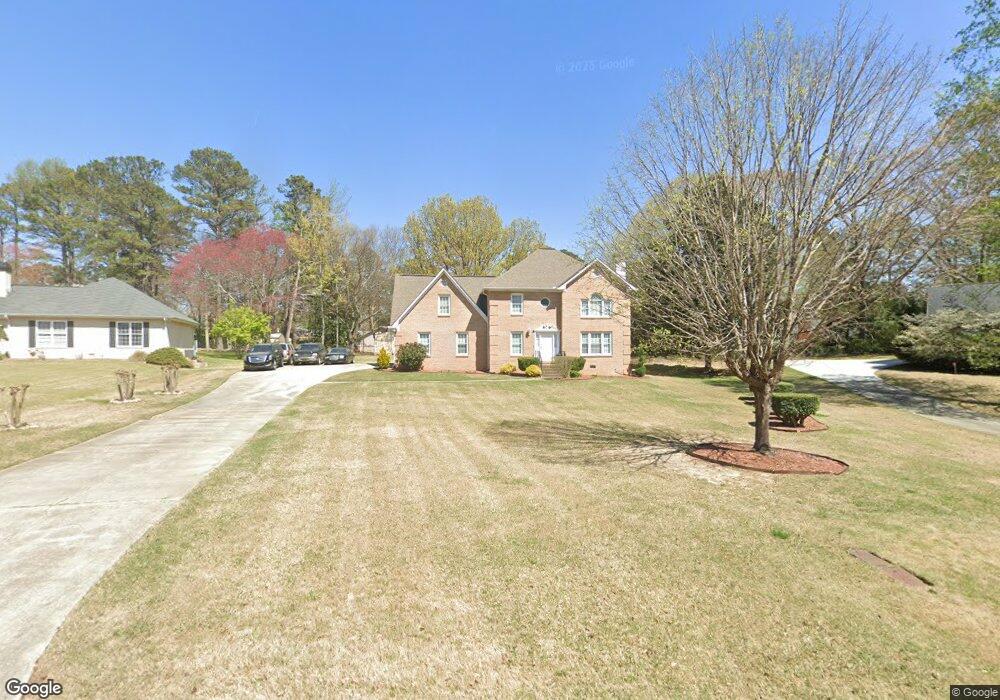
2002 Amber Leaf Ct Jonesboro, GA 30236
Estimated Value: $264,831 - $339,000
4
Beds
3
Baths
2,196
Sq Ft
$139/Sq Ft
Est. Value
About This Home
This home is located at 2002 Amber Leaf Ct, Jonesboro, GA 30236 and is currently estimated at $305,458, approximately $139 per square foot. 2002 Amber Leaf Ct is a home located in Clayton County with nearby schools including Arnold Elementary School, M. D. Roberts Middle School, and Jonesboro High School.
Ownership History
Date
Name
Owned For
Owner Type
Purchase Details
Closed on
Feb 1, 2019
Sold by
Johnson Vivienne Yvonne
Bought by
Pearson Latresa and Kellogg Jerry
Current Estimated Value
Home Financials for this Owner
Home Financials are based on the most recent Mortgage that was taken out on this home.
Original Mortgage
$162,011
Outstanding Balance
$145,484
Interest Rate
5.62%
Mortgage Type
FHA
Estimated Equity
$159,974
Purchase Details
Closed on
Dec 22, 2015
Sold by
Johnson Herbert Roy
Bought by
Johnson Vivienne Yvonne
Purchase Details
Closed on
May 27, 1998
Sold by
Anderson Michael D and Anderson Mary D
Bought by
Johnson Herbert Roy and Johnson Vivienne Yvonne
Home Financials for this Owner
Home Financials are based on the most recent Mortgage that was taken out on this home.
Original Mortgage
$126,176
Interest Rate
7.15%
Mortgage Type
FHA
Create a Home Valuation Report for This Property
The Home Valuation Report is an in-depth analysis detailing your home's value as well as a comparison with similar homes in the area
Home Values in the Area
Average Home Value in this Area
Purchase History
| Date | Buyer | Sale Price | Title Company |
|---|---|---|---|
| Pearson Latresa | $165,000 | -- | |
| Johnson Vivienne Yvonne | -- | -- | |
| Johnson Herbert Roy | $137,000 | -- |
Source: Public Records
Mortgage History
| Date | Status | Borrower | Loan Amount |
|---|---|---|---|
| Open | Pearson Latresa | $162,011 | |
| Previous Owner | Johnson Herbert Roy | $126,176 |
Source: Public Records
Tax History Compared to Growth
Tax History
| Year | Tax Paid | Tax Assessment Tax Assessment Total Assessment is a certain percentage of the fair market value that is determined by local assessors to be the total taxable value of land and additions on the property. | Land | Improvement |
|---|---|---|---|---|
| 2024 | $5,036 | $128,120 | $9,600 | $118,520 |
| 2023 | $4,197 | $116,240 | $9,600 | $106,640 |
| 2022 | $3,322 | $83,680 | $9,600 | $74,080 |
| 2021 | $2,627 | $65,560 | $9,600 | $55,960 |
| 2020 | $2,547 | $62,745 | $9,600 | $53,145 |
| 2019 | $2,296 | $55,625 | $9,200 | $46,425 |
| 2018 | $2,405 | $58,294 | $9,200 | $49,094 |
| 2017 | $1,618 | $48,836 | $9,200 | $39,636 |
| 2016 | $1,483 | $45,504 | $9,200 | $36,304 |
| 2015 | $1,167 | $0 | $0 | $0 |
| 2014 | $986 | $33,814 | $9,200 | $24,614 |
Source: Public Records
Map
Nearby Homes
- 7972 Woods Ln Unit IX
- 1904 Cades Cove
- 2140 Indian Hill Rd
- 8228 Lullwater Ct
- 1732 Winding Woods Ln
- 1837 Coventry Way
- 1753 Brenda Dr
- 7942 Rand Rd
- 0 Highway 138 E Unit 10460006
- 0 Highway 138 E Unit 10650191
- 0 Highway 138 E Unit 10638505
- 2238 Danver Ct
- 7940 Rand Rd
- 1699 Brenda Dr Unit 2
- 1914 Lullwater Cir Unit V
- 2115 Logan Dr
- 1938 Wrights Way
- 8327 Commanche Ct
- 7620 Mount Zion Blvd
- 7621 Raleigh Ln
- 2006 Amber Leaf Ct
- 1996 Amber Leaf Ct
- 7999 Autumn Forest Dr
- 8011 Autumn Forest Dr
- 7987 Autumn Forest Dr
- 1990 Amber Leaf Ct Unit 8
- 2010 Amber Leaf Ct
- 8023 Autumn Forest Dr
- 1979 Amber Leaf Ct Unit VIII
- 2007 Amber Leaf Ct
- 8035 Autumn Forest Dr Unit 1
- 1984 Amber Leaf Ct Unit VIII
- 8000 Autumn Forest Dr
- 2003 Amber Leaf Ct Unit VIII
- 8012 Autumn Forest Dr
- 0 Amber Leaf Ct Unit 8664747
- 0 Amber Leaf Ct Unit 8215075
- 8041 Autumn Forest Dr Unit V
- 1974 Amber Leaf Ct
- 8022 Autumn Forest Dr