2002 Ashe St Durham, NC 27703
East Durham NeighborhoodEstimated Value: $249,000 - $307,000
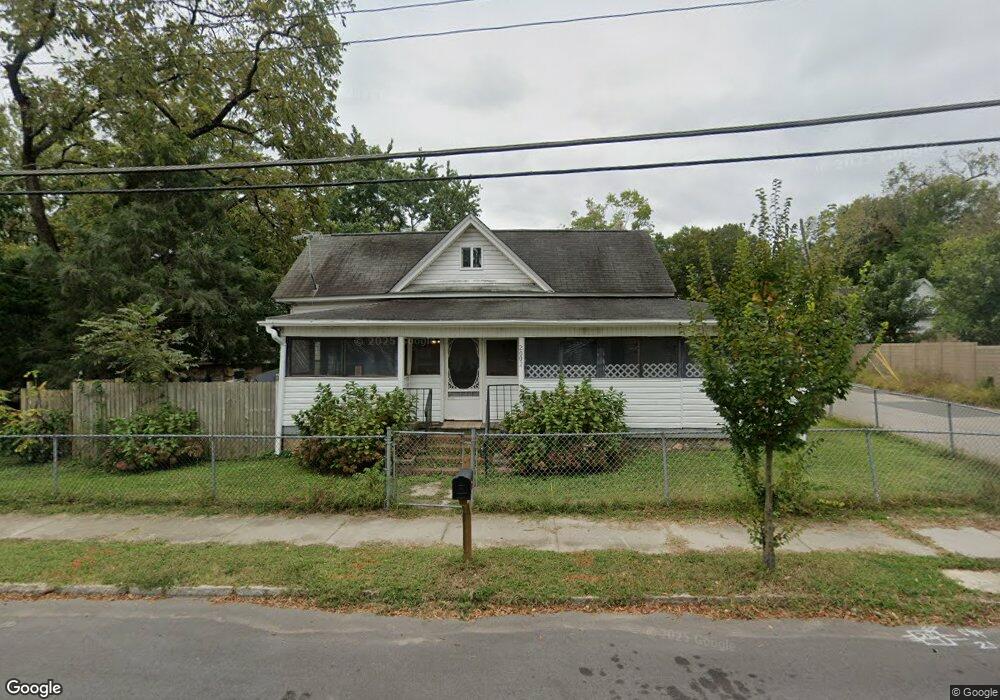
About This Home
This home is located at 2002 Ashe St, Durham, NC 27703 and is currently estimated at $267,747, approximately $228 per square foot. 2002 Ashe St is a home located in Durham County with nearby schools including Y E Smith Elementary, W.G. Pearson Elementary School, and Brogden Middle.
Ownership History
We collect this data history from publicly available records. To have your information removed, we recommend requesting removal directly through your county’s website.
Purchase Details
Purchase Details
Purchase Details
Home Values in the Area
Average Home Value in this Area
Purchase History
We collect this data history from publicly available records. To have your information removed, we recommend requesting removal directly through your county’s website.
| Date | Buyer | Sale Price | Title Company |
|---|---|---|---|
| -- | None Available | ||
| -- | None Available | ||
| -- | -- |
Tax History
We collect this data history from publicly available records. To have your information removed, we recommend requesting removal directly through your county’s website.
| Year | Tax Paid | Tax Assessment Tax Assessment Total Assessment is a certain percentage of the fair market value that is determined by local assessors to be the total taxable value of land and additions on the property. | Land | Improvement |
|---|---|---|---|---|
| 2025 | $1,156 | $233,191 | $102,600 | $130,591 |
| 2024 | $606 | $86,953 | $25,560 | $61,393 |
| 2023 | $556 | $86,953 | $25,560 | $61,393 |
| 2022 | $556 | $86,953 | $25,560 | $61,393 |
| 2021 | $554 | $86,953 | $25,560 | $61,393 |
| 2020 | $1,082 | $86,953 | $25,560 | $61,393 |
| 2019 | $541 | $86,953 | $25,560 | $61,393 |
| 2018 | $462 | $68,086 | $14,200 | $53,886 |
| 2017 | $458 | $68,086 | $14,200 | $53,886 |
| 2016 | $443 | $68,086 | $14,200 | $53,886 |
| 2015 | $415 | $59,964 | $8,691 | $51,273 |
| 2014 | $415 | $59,964 | $8,691 | $51,273 |
Map
- 1916 Hart St
- 1816 Vale St
- 101 S Maple St
- 104 S Driver St
- 2065 Bull City Bend Unit 403
- 2001 Bull City Bend Unit 387
- 2037 Bull City Bend Unit 396
- 1702 E Main St
- 310 Cody St
- 2302 Angier Ave
- 111 N Guthrie Ave
- 110 N Guthrie Ave
- 506 Bruce St
- 2318 E Main St
- 618 Troy St
- 2510 Harvard Ave
- 313 N Hyde Park Ave
- 2337 E Main St
- 2005 Taylor St
- 415 Sowell St
Ask me questions while you tour the home.