
Seller's Agent in 2025
Danielle Vaillancourt
Realty One Group Eminence
(775) 771-1150
1 in this area
26 Total Sales
Estimated Value: $576,000 - $643,000
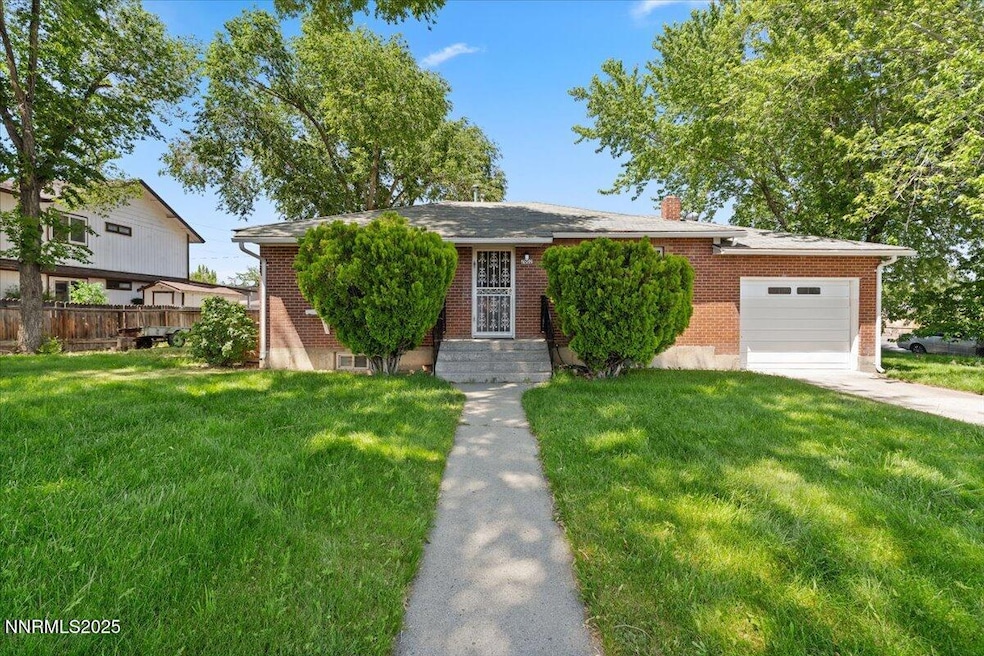
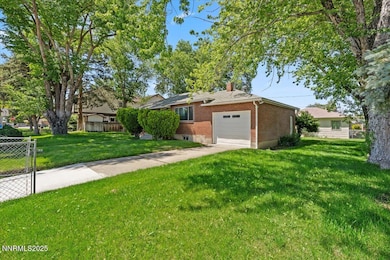
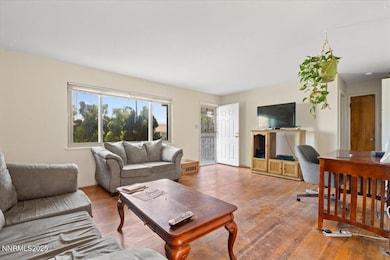
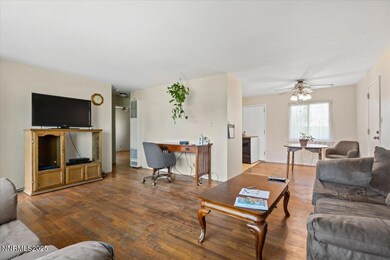
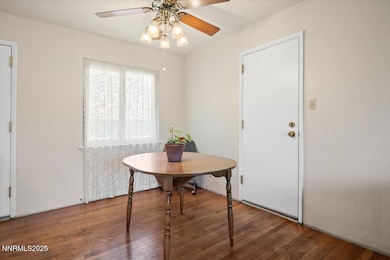
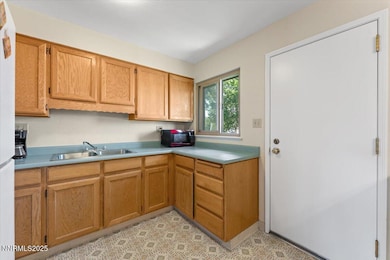
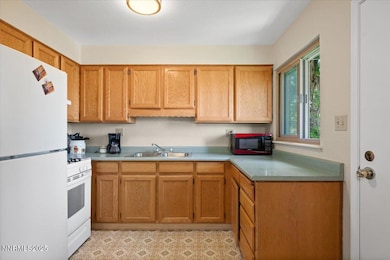
Incredible opportunity to own this charming brick home located on a lush .21 acre lot, with a 2 bedroom cottage located on the same parcel. The brick home located at the front of the property is 910 sqft with fresh interior paint, 2 bedrooms, 1 bathroom, a spacious garage, and a 910 sqft unfinished basement with fresh interior paint, housing a 1/2 bathroom and laundry area. The Cottage located behind the brick home on 711 20th Street is 780 sqft with 2 bedrooms, 1 bathroom, a new gas stove, a new refrigerator and new exterior paint. There are original Red Oak hardwood floors in both homes, along with fresh interior paint, triple pane windows, attic insulation, as well as newer gas wall furnaces and gas water heaters. Lush landscaping includes a working irrigation system, as well as a beautiful mature cherry tree. As a bonus, the vacant lot located at 0 F Street running along the west side of the property, is included in the sale. The lot is .07 acres (APN 03126308), giving even more space to this beautiful property full of opportunity. Both of the homes have been well maintained by the original family. Contact the listing agents to see for yourself!
Last Agent to Sell the Property
Realty One Group Eminence License #S.186426 Listed on: 06/27/2025
| Date | Buyer | Sale Price | Title Company |
|---|---|---|---|
| Lagunas Jesus Manuel Ruiz | -- | First American Title | |
| Lagunas Jesus Manuel Ruiz | $600,000 | First American Title | |
| Leautier Living Trust | -- | None Listed On Document | |
| Chesnut Living Trust | -- | None Listed On Document | |
| Chesnut Michon Laurel | -- | None Listed On Document | |
| The Dennis & Evelyn Cooper Family Trust | -- | None Available | |
| Leautier Sharon Kay | -- | None Available | |
| Leautier Arthur Albert | -- | None Available | |
| Leautier Sharon | -- | -- |
| Date | Status | Borrower | Loan Amount |
|---|---|---|---|
| Open | Lagunas Jesus Manuel Ruiz | $570,000 |
| Date | Event | Price | List to Sale | Price per Sq Ft |
|---|---|---|---|---|
| 12/04/2025 12/04/25 | Sold | $600,000 | -4.0% | $355 / Sq Ft |
| 06/27/2025 06/27/25 | For Sale | $625,000 | -- | $370 / Sq Ft |
| Year | Tax Paid | Tax Assessment Tax Assessment Total Assessment is a certain percentage of the fair market value that is determined by local assessors to be the total taxable value of land and additions on the property. | Land | Improvement |
|---|---|---|---|---|
| 2026 | $1,005 | $71,486 | $40,880 | $30,606 |
| 2025 | $1,334 | $72,173 | $41,720 | $30,453 |
| 2024 | $1,334 | $68,312 | $38,710 | $29,602 |
| 2023 | $1,348 | $66,657 | $39,305 | $27,352 |
| 2022 | $1,249 | $55,242 | $32,865 | $22,377 |
| 2021 | $1,161 | $47,157 | $25,375 | $21,782 |
| 2020 | $1,096 | $47,674 | $26,250 | $21,424 |
| 2019 | $1,040 | $42,696 | $22,470 | $20,226 |
| 2018 | $1,000 | $34,626 | $15,190 | $19,436 |
| 2017 | $963 | $33,086 | $14,000 | $19,086 |
| 2016 | $936 | $30,173 | $11,200 | $18,973 |
| 2015 | $258 | $26,811 | $8,050 | $18,761 |
| 2014 | $907 | $24,803 | $7,000 | $17,803 |
| 2013 | -- | $23,450 | $6,160 | $17,290 |
Seller's Agent in 2025
Danielle Vaillancourt
Realty One Group Eminence
(775) 771-1150
1 in this area
26 Total Sales
Seller Co-Listing Agent in 2025
Shellyn Ireland
Realty One Group Eminence
(775) 741-6127
1 in this area
27 Total Sales
Buyer's Agent in 2025
Mona Sanatgaran
Solid Source Realty
(775) 291-3239
1 in this area
23 Total Sales
Source: Northern Nevada Regional MLS
MLS Number: 250052230
APN: 031-263-06
Disclaimer: Certain information contained herein is derived from information provided by parties other than Homes.com. All information provided is deemed reliable, but is not guaranteed to be accurate and should be independently verified.
![]() IDX information is provided exclusively for personal, non-commercial use, and may not be used for any purpose other than to identify prospective properties consumers may be interested in purchasing. Information is deemed reliable but not guaranteed. The content relating to real estate for sale on this web site comes in part from the Broker Reciprocity/ IDX program of the Northern Nevada Regional Multiple Listing Service°. Real estate listings held by brokerage firms other than Ten-X are marked with the Broker Reciprocity logo and detailed information about those listings includes the name of the listing brokerage. Any use of the content other than by a search performed by a consumer looking to purchase or rent real estate is prohibited. © 2026 Northern Nevada Regional Multiple Listing Service® MLS. All rights reserved.
IDX information is provided exclusively for personal, non-commercial use, and may not be used for any purpose other than to identify prospective properties consumers may be interested in purchasing. Information is deemed reliable but not guaranteed. The content relating to real estate for sale on this web site comes in part from the Broker Reciprocity/ IDX program of the Northern Nevada Regional Multiple Listing Service°. Real estate listings held by brokerage firms other than Ten-X are marked with the Broker Reciprocity logo and detailed information about those listings includes the name of the listing brokerage. Any use of the content other than by a search performed by a consumer looking to purchase or rent real estate is prohibited. © 2026 Northern Nevada Regional Multiple Listing Service® MLS. All rights reserved.
Ask me questions while you tour the home.