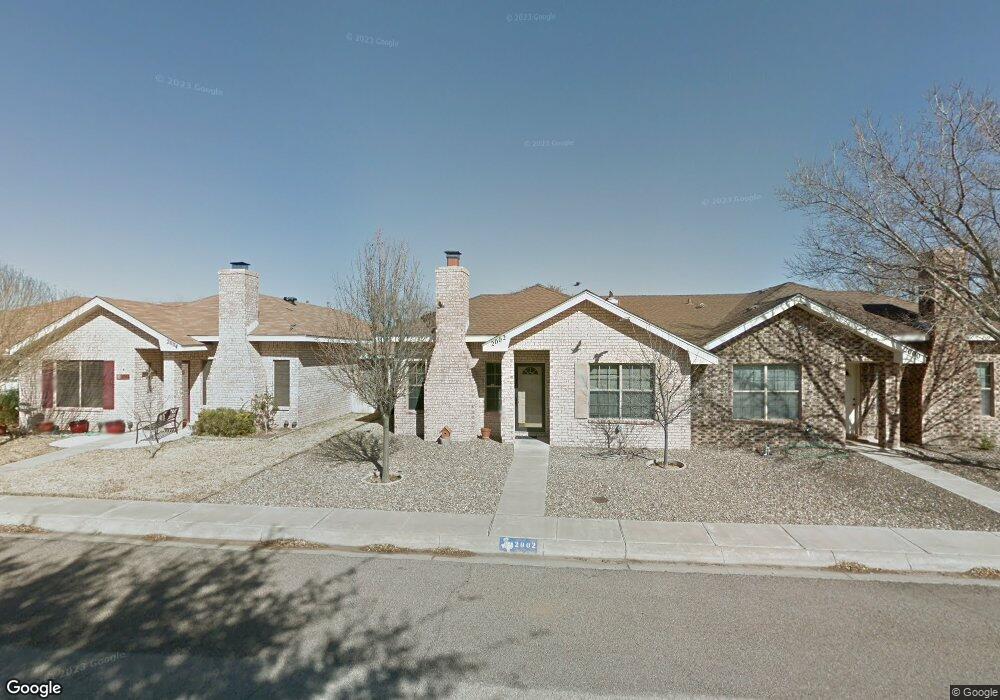
2002 Freeport Ln Midland, TX 79707
Wedgewood Park NeighborhoodEstimated Value: $230,250 - $247,000
--
Bed
--
Bath
1,319
Sq Ft
$180/Sq Ft
Est. Value
About This Home
This home is located at 2002 Freeport Ln, Midland, TX 79707 and is currently estimated at $238,063, approximately $180 per square foot. 2002 Freeport Ln is a home located in Midland County with nearby schools including Rusk Elementary School, Alamo Junior High School, and Permian Basin Classical Academy.
Ownership History
Date
Name
Owned For
Owner Type
Purchase Details
Closed on
Dec 13, 2021
Sold by
Blaylock Steve and Blaylock Mary Ann
Bought by
Gowin Kelby W and Gowin Ashley
Current Estimated Value
Home Financials for this Owner
Home Financials are based on the most recent Mortgage that was taken out on this home.
Original Mortgage
$148,000
Outstanding Balance
$135,897
Interest Rate
3.14%
Mortgage Type
New Conventional
Estimated Equity
$102,166
Purchase Details
Closed on
Jul 27, 2016
Sold by
Nicholas Kirk J
Bought by
Blaylock Steve and Blaylock Mary Ann
Purchase Details
Closed on
Oct 18, 2005
Sold by
Miether Geneva L
Bought by
Hewett Calvin J
Home Financials for this Owner
Home Financials are based on the most recent Mortgage that was taken out on this home.
Original Mortgage
$78,350
Interest Rate
5.69%
Mortgage Type
New Conventional
Purchase Details
Closed on
Mar 25, 1992
Bought by
Blaylock Steve
Purchase Details
Closed on
Jan 1, 1901
Bought by
Blaylock Steve
Create a Home Valuation Report for This Property
The Home Valuation Report is an in-depth analysis detailing your home's value as well as a comparison with similar homes in the area
Home Values in the Area
Average Home Value in this Area
Purchase History
| Date | Buyer | Sale Price | Title Company |
|---|---|---|---|
| Gowin Kelby W | -- | West Tx Abstract & Ttl Co Ll | |
| Blaylock Steve | -- | Lone Star Abstract & Title C | |
| Hewett Calvin J | -- | None Available | |
| Blaylock Steve | -- | -- | |
| Blaylock Steve | -- | -- |
Source: Public Records
Mortgage History
| Date | Status | Borrower | Loan Amount |
|---|---|---|---|
| Open | Gowin Kelby W | $148,000 | |
| Previous Owner | Hewett Calvin J | $78,350 |
Source: Public Records
Tax History Compared to Growth
Tax History
| Year | Tax Paid | Tax Assessment Tax Assessment Total Assessment is a certain percentage of the fair market value that is determined by local assessors to be the total taxable value of land and additions on the property. | Land | Improvement |
|---|---|---|---|---|
| 2025 | $2,820 | $183,630 | $7,880 | $175,750 |
| 2024 | $2,824 | $185,940 | $7,880 | $178,060 |
| 2023 | $2,787 | $185,940 | $7,880 | $178,060 |
| 2022 | $2,762 | $176,750 | $7,880 | $168,870 |
| 2021 | $2,979 | $170,980 | $7,880 | $163,100 |
| 2020 | $2,905 | $167,650 | $7,880 | $159,770 |
| 2019 | $3,174 | $167,650 | $7,880 | $159,770 |
| 2018 | $3,041 | $156,420 | $7,880 | $148,540 |
| 2017 | $2,948 | $151,640 | $7,880 | $143,760 |
| 2016 | $2,916 | $157,700 | $7,880 | $149,820 |
| 2015 | -- | $151,390 | $7,880 | $143,510 |
| 2014 | -- | $144,990 | $7,880 | $137,110 |
Source: Public Records
Map
Nearby Homes
- 2000 Freeport Ln
- 1824 Northern Ln
- 1818 Northern Ln
- 4313 W Dengar Ave
- 1509 Cascade Ct
- 3523 Lonoke Ave
- 3517 Seaboard Ave
- 3802 Suncrest Ave
- 1502 Alcove Ct
- 2906 Aurora Ln
- 4342 W Dengar Ave
- 2306 Abbey Place
- 3200 Highsky Dr
- 0000 N Midland Dr
- 4310 Nelson Rd
- 2106 Rosita Dr
- 1715 Bates St
- 4206 Nelson Rd
- 4618 Andrews Hwy
- 4620 Andrews Hwy
- 2004 Freeport Ln
- 2006 Freeport Ln
- 2008 Freeport Ln
- 2003 Freeport Ln
- 2100 Freeport Ln
- 2005 Freeport Ln
- 2001 Freeport Ln
- 2007 Freeport Ln
- 3802 Shell Ave
- 2009 Freeport Ln
- 2102 Freeport Ln
- 2101 Freeport Ln
- 2104 Freeport Ln
- 2103 Freeport Ln
- 2106 Freeport Ln
- 2105 Freeport Ln
- 2002 Westwind Dr
- 2004 Westwind Dr
- 2000 Westwind Dr
- 2006 Westwind Dr