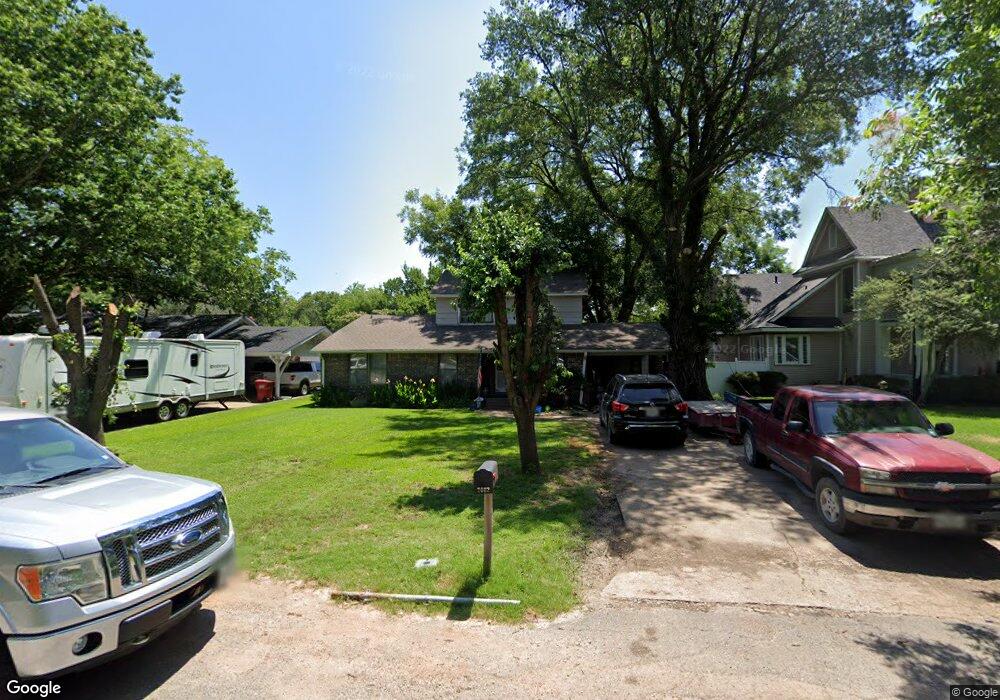
2002 Liberty St Bonham, TX 75418
Estimated Value: $184,000 - $230,000
3
Beds
3
Baths
1,893
Sq Ft
$114/Sq Ft
Est. Value
About This Home
This home is located at 2002 Liberty St, Bonham, TX 75418 and is currently estimated at $215,602, approximately $113 per square foot. 2002 Liberty St is a home located in Fannin County with nearby schools including Finley-Oates Elementary School and LH Rather Jr High School.
Ownership History
Date
Name
Owned For
Owner Type
Purchase Details
Closed on
Jan 10, 2011
Sold by
Bunch Gerald and Bunch Debbie
Bought by
Cruz Jose Antonio and Cruz Miranda Hope
Current Estimated Value
Home Financials for this Owner
Home Financials are based on the most recent Mortgage that was taken out on this home.
Original Mortgage
$350,000
Outstanding Balance
$232,918
Interest Rate
4.44%
Estimated Equity
-$17,316
Purchase Details
Closed on
May 19, 2008
Sold by
Secretary Of Hud
Bought by
Cruz Jose A
Home Financials for this Owner
Home Financials are based on the most recent Mortgage that was taken out on this home.
Original Mortgage
$76,023
Interest Rate
5.89%
Purchase Details
Closed on
Nov 14, 2006
Sold by
Lawrence Nancy Jean Dorothy and Dority Nancy Jean
Bought by
Morrison Ronald and Morrison Laquita
Home Financials for this Owner
Home Financials are based on the most recent Mortgage that was taken out on this home.
Original Mortgage
$94,651
Interest Rate
6.26%
Mortgage Type
FHA
Create a Home Valuation Report for This Property
The Home Valuation Report is an in-depth analysis detailing your home's value as well as a comparison with similar homes in the area
Home Values in the Area
Average Home Value in this Area
Purchase History
| Date | Buyer | Sale Price | Title Company |
|---|---|---|---|
| Cruz Jose Antonio | -- | None Available | |
| Cruz Jose A | -- | None Available | |
| Morrison Ronald | -- | None Available |
Source: Public Records
Mortgage History
| Date | Status | Borrower | Loan Amount |
|---|---|---|---|
| Open | Cruz Jose Antonio | $350,000 | |
| Previous Owner | Cruz Jose A | $76,023 | |
| Previous Owner | Morrison Ronald | $94,651 |
Source: Public Records
Tax History Compared to Growth
Tax History
| Year | Tax Paid | Tax Assessment Tax Assessment Total Assessment is a certain percentage of the fair market value that is determined by local assessors to be the total taxable value of land and additions on the property. | Land | Improvement |
|---|---|---|---|---|
| 2025 | $1,923 | $154,040 | $34,050 | $119,990 |
| 2024 | $1,923 | $164,640 | $38,900 | $125,740 |
| 2023 | $2,710 | $156,210 | $33,080 | $123,130 |
| 2022 | $2,748 | $143,030 | $24,260 | $118,770 |
| 2021 | $2,871 | $113,580 | $11,470 | $102,110 |
| 2020 | $2,759 | $110,570 | $10,060 | $100,510 |
| 2019 | $2,608 | $98,140 | $6,000 | $92,140 |
| 2018 | $2,444 | $92,080 | $6,000 | $86,080 |
| 2017 | $2,145 | $83,940 | $5,910 | $78,030 |
| 2016 | $1,975 | $77,290 | $5,910 | $71,380 |
| 2015 | -- | $79,370 | $5,730 | $73,640 |
| 2014 | -- | $80,530 | $5,470 | $75,060 |
Source: Public Records
Map
Nearby Homes
- 1905 Agnew St
- 2108 Agnew St
- 1913 N Main St
- 108 Leslie St
- 2023 N Center St
- 606 Hunter St
- 000 S State Highway 78
- 1711 Oriental St
- 0000 Texas 78
- 5354 S State Highway 78
- 200 Victory St
- TBD Saint Andrews Ct
- 0000 Lee St
- 408 Rainey St
- 2099 Albert Broadfoot St
- 2099 Albert Broadfoot St Unit A
- 1609 Kennedy St
- 1525 Franklin St
- 2 Broadmoor Ct
- 2109 Island Bayou
- 2004 Liberty St
- 2000 Liberty St
- 2005 Franklin Ave
- 2006 Liberty St
- 2007 Franklin Ave
- 2005 Liberty St
- 2001 Franklin Ave
- 2001 Liberty St
- 1924 Liberty St
- 2009 Liberty St
- 1925 Franklin Ave
- 1920 Liberty St
- 1937 Liberty St
- 204 W Russell Ave
- 1933 Liberty St
- 2004 Agnew St
- 1916 Liberty St
- 2000 Agnew St
- 202 W Russell Ave
- 2022 Franklin Ave