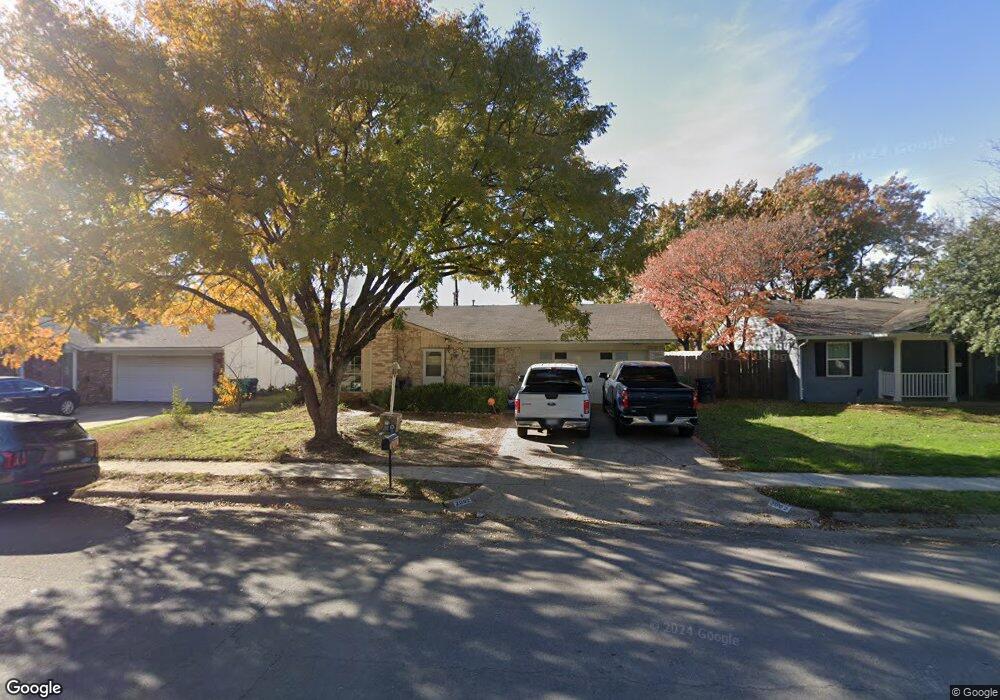
2002 Mccormick St Denton, TX 76205
Denia NeighborhoodEstimated Value: $246,536 - $282,000
3
Beds
2
Baths
1,057
Sq Ft
$252/Sq Ft
Est. Value
About This Home
This home is located at 2002 Mccormick St, Denton, TX 76205 and is currently estimated at $266,884, approximately $252 per square foot. 2002 Mccormick St is a home located in Denton County with nearby schools including Borman Elementary School, McMath Middle School, and Denton High School.
Ownership History
Date
Name
Owned For
Owner Type
Purchase Details
Closed on
Apr 6, 2004
Sold by
Hoffman Brian S
Bought by
Barrera Juan and Barrera Silvia
Current Estimated Value
Home Financials for this Owner
Home Financials are based on the most recent Mortgage that was taken out on this home.
Original Mortgage
$74,077
Outstanding Balance
$43,211
Interest Rate
9.25%
Mortgage Type
Purchase Money Mortgage
Estimated Equity
$223,673
Purchase Details
Closed on
Jul 9, 1997
Sold by
Carpenter Eric C and Carpenter Bonnie B
Bought by
Hoffmann Brian S
Home Financials for this Owner
Home Financials are based on the most recent Mortgage that was taken out on this home.
Original Mortgage
$69,950
Interest Rate
7.85%
Mortgage Type
FHA
Create a Home Valuation Report for This Property
The Home Valuation Report is an in-depth analysis detailing your home's value as well as a comparison with similar homes in the area
Home Values in the Area
Average Home Value in this Area
Purchase History
| Date | Buyer | Sale Price | Title Company |
|---|---|---|---|
| Barrera Juan | -- | American Title | |
| Hoffmann Brian S | -- | -- |
Source: Public Records
Mortgage History
| Date | Status | Borrower | Loan Amount |
|---|---|---|---|
| Open | Barrera Juan | $74,077 | |
| Previous Owner | Hoffmann Brian S | $69,950 | |
| Closed | Barrera Juan | $18,519 |
Source: Public Records
Tax History
| Year | Tax Paid | Tax Assessment Tax Assessment Total Assessment is a certain percentage of the fair market value that is determined by local assessors to be the total taxable value of land and additions on the property. | Land | Improvement |
|---|---|---|---|---|
| 2025 | $4,551 | $227,439 | $60,482 | $166,957 |
| 2024 | $4,551 | $235,771 | $60,482 | $175,289 |
| 2023 | $4,867 | $254,924 | $60,482 | $194,442 |
| 2022 | $4,539 | $213,814 | $60,482 | $153,332 |
| 2021 | $3,467 | $155,944 | $40,321 | $115,623 |
| 2020 | $3,465 | $151,599 | $40,321 | $111,278 |
| 2019 | $3,656 | $153,206 | $40,321 | $112,885 |
| 2018 | $3,257 | $134,838 | $40,321 | $94,517 |
| 2017 | $3,298 | $133,430 | $38,305 | $95,125 |
| 2016 | $3,223 | $102,354 | $24,366 | $77,988 |
| 2015 | $2,302 | $97,282 | $24,366 | $72,916 |
| 2013 | -- | $90,668 | $28,427 | $62,241 |
Source: Public Records
Map
Nearby Homes
- 1523 Oakwood Dr
- 1619 Mccormick St
- 2302 Mercedes Rd
- 1300 Lindsey St
- 1302 Lindsey St
- 2213 Ruff Rd
- 2314 Leslie St
- 631 Acme St
- 2321 Ruff Rd
- 1909 Willowcrest Loop
- 2320 Bernard St
- 2304 Blackcap St
- 2620 Mccormick St
- 1600 Woodpecker St
- 2020 Apalis Dr
- 2509 Goldfinch Dr
- 2513 Goldfinch Dr
- 1605 Woodpecker St
- 2615 Flycatcher Dr
- 2012 Tawny Dr
- 1918 Mccormick St
- 2006 Mccormick St
- 2010 Mccormick St
- 1906 Mccormick St
- 2003 Mccormick St
- 1919 Mccormick St
- 2014 Mccormick St
- 2007 Mccormick St
- 1915 Mccormick St
- 2011 Mccormick St
- 2018 Mccormick St
- 2015 Mccormick St
- 2002 Westwood Dr
- 1918 Westwood Dr
- 2006 Westwood Dr
- 2019 Mccormick St
- 2022 Mccormick St
- 1914 Westwood Dr
- 2010 Westwood Dr
- 2023 Mccormick St
Your Personal Tour Guide
Ask me questions while you tour the home.