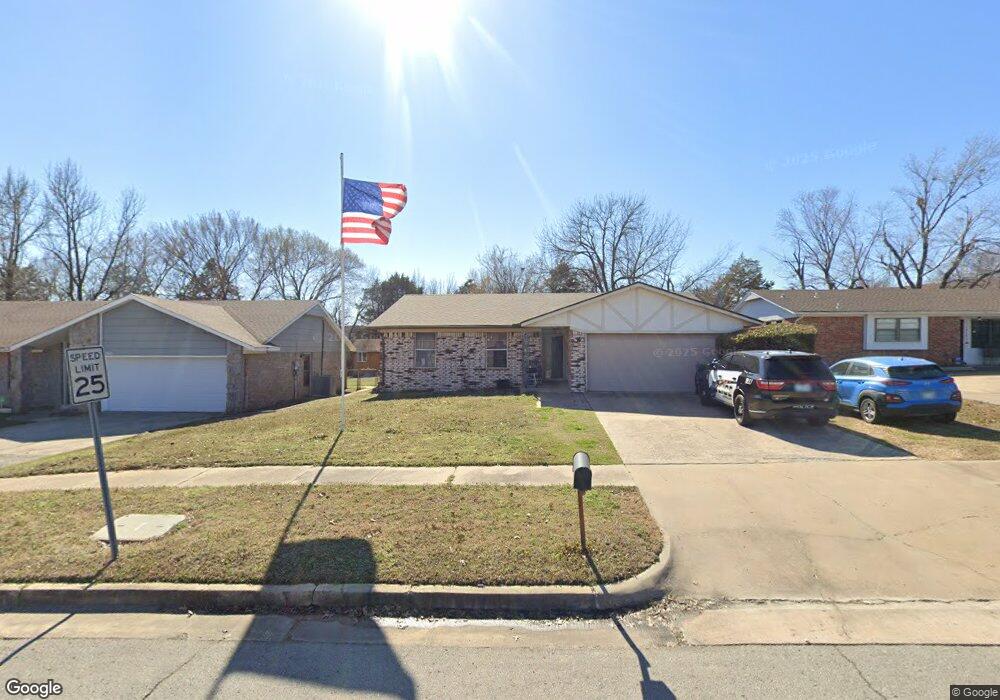
2002 S Bixby St Sapulpa, OK 74066
Estimated Value: $135,000 - $194,000
2
Beds
2
Baths
1,155
Sq Ft
$138/Sq Ft
Est. Value
About This Home
This home is located at 2002 S Bixby St, Sapulpa, OK 74066 and is currently estimated at $159,123, approximately $137 per square foot. 2002 S Bixby St is a home located in Creek County with nearby schools including Sapulpa Middle School, Sapulpa Junior High School, and Sapulpa High School.
Ownership History
Date
Name
Owned For
Owner Type
Purchase Details
Closed on
Nov 3, 2020
Sold by
Madden Jimmy L and Madden Crystal Elaine
Bought by
Madden Jimmy L and Madden Crystal Elaine
Current Estimated Value
Purchase Details
Closed on
Aug 9, 2013
Sold by
Madden Jimmy Lynn
Bought by
Madden Jimmy Lynn and Madden Crystal Elaine
Purchase Details
Closed on
Oct 11, 2005
Sold by
Madden Jimmy L and Madden Starla J
Bought by
Madden Jimmy L
Create a Home Valuation Report for This Property
The Home Valuation Report is an in-depth analysis detailing your home's value as well as a comparison with similar homes in the area
Home Values in the Area
Average Home Value in this Area
Purchase History
| Date | Buyer | Sale Price | Title Company |
|---|---|---|---|
| Madden Jimmy L | -- | None Available | |
| Madden Jimmy Lynn | -- | None Available | |
| Madden Jimmy L | -- | None Available |
Source: Public Records
Tax History Compared to Growth
Tax History
| Year | Tax Paid | Tax Assessment Tax Assessment Total Assessment is a certain percentage of the fair market value that is determined by local assessors to be the total taxable value of land and additions on the property. | Land | Improvement |
|---|---|---|---|---|
| 2025 | $1,161 | $10,869 | $2,400 | $8,469 |
| 2024 | $1,161 | $10,552 | $2,400 | $8,152 |
| 2023 | $1,161 | $10,245 | $2,400 | $7,845 |
| 2022 | $1,028 | $9,946 | $2,400 | $7,546 |
| 2021 | $1,027 | $9,657 | $2,400 | $7,257 |
| 2020 | $991 | $9,399 | $2,400 | $6,999 |
| 2019 | $1,010 | $9,517 | $2,400 | $7,117 |
| 2018 | $1,030 | $9,513 | $2,338 | $7,175 |
| 2017 | $992 | $9,237 | $2,198 | $7,039 |
| 2016 | $912 | $8,967 | $2,061 | $6,906 |
| 2015 | -- | $8,707 | $1,929 | $6,778 |
| 2014 | -- | $8,453 | $1,800 | $6,653 |
Source: Public Records
Map
Nearby Homes
- 1915 S Muskogee St
- 605 W Mockingbird Ln
- 1836 S Oklahoma St
- 1965 S Scott St
- 416 W Fairlane Dr Unit A-B
- 273 W Fairlane Dr
- 142 W Fairlane Ct
- 41 W Fairlane Ct
- 1424 S Main St
- 1220 S Cedar St
- 19 E Fairlane Ct
- 119 E Ross Ave
- 120 E Burnham Ave
- 1120 W Keeling Ave
- 925 S Oklahoma St
- 1160 W Keeling Ave
- 920 S Oklahoma St
- 119 E Davis Ave
- 211 E Wells Blvd
- 209 W Norma St
- 1930 S Bixby St
- 2006 S Bixby St
- 1926 S Bixby St
- 2010 S Bixby St
- 2003 S Bixby St
- 2014 S Bixby St
- 1922 S Bixby St
- 1925 S Bixby St
- 1927 S Muskogee St
- 2009 S Bixby St
- 2018 S Bixby St
- 1922 S Muskogee St
- 1918 S Bixby St
- 1919 S Bixby St
- 1923 S Muskogee St
- 2024 S Bixby St
- 1914 S Bixby St
- 2017 S Bixby St
- 1916 S Muskogee St
- 610 W Mockingbird Ln