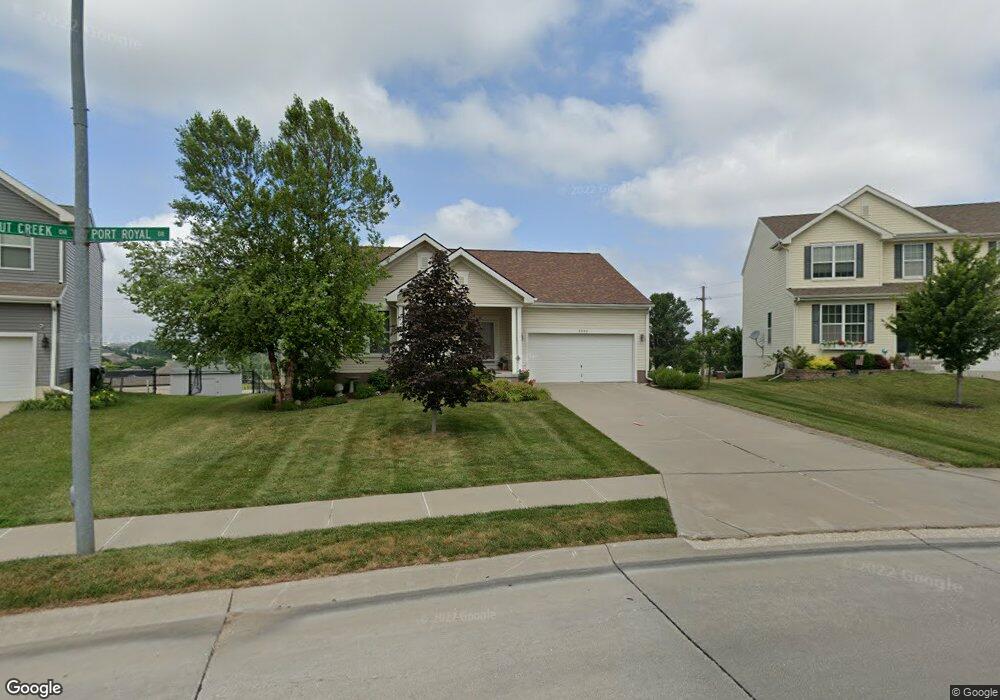
2002 Walnut Creek Dr Papillion, NE 68046
Estimated Value: $332,000 - $370,000
3
Beds
2
Baths
1,494
Sq Ft
$234/Sq Ft
Est. Value
About This Home
This home is located at 2002 Walnut Creek Dr, Papillion, NE 68046 and is currently estimated at $349,046, approximately $233 per square foot. 2002 Walnut Creek Dr is a home located in Sarpy County with nearby schools including Patriot Elementary School, Liberty Middle School, and Papillion La Vista South High School.
Ownership History
Date
Name
Owned For
Owner Type
Purchase Details
Closed on
Jan 23, 2008
Sold by
Hearthstone Homes Inc
Bought by
Peers Maurice J and Peers Mary J
Current Estimated Value
Home Financials for this Owner
Home Financials are based on the most recent Mortgage that was taken out on this home.
Original Mortgage
$158,924
Outstanding Balance
$102,826
Interest Rate
6.11%
Mortgage Type
Small Business Administration
Estimated Equity
$246,220
Create a Home Valuation Report for This Property
The Home Valuation Report is an in-depth analysis detailing your home's value as well as a comparison with similar homes in the area
Home Values in the Area
Average Home Value in this Area
Purchase History
| Date | Buyer | Sale Price | Title Company |
|---|---|---|---|
| Peers Maurice J | $159,000 | Fat |
Source: Public Records
Mortgage History
| Date | Status | Borrower | Loan Amount |
|---|---|---|---|
| Open | Peers Maurice J | $158,924 |
Source: Public Records
Tax History Compared to Growth
Tax History
| Year | Tax Paid | Tax Assessment Tax Assessment Total Assessment is a certain percentage of the fair market value that is determined by local assessors to be the total taxable value of land and additions on the property. | Land | Improvement |
|---|---|---|---|---|
| 2025 | $5,251 | $311,309 | $54,000 | $257,309 |
| 2024 | $5,750 | $302,810 | $50,000 | $252,810 |
| 2023 | $5,750 | $275,191 | $47,000 | $228,191 |
| 2022 | $5,481 | $240,499 | $42,000 | $198,499 |
| 2021 | $5,351 | $228,790 | $39,000 | $189,790 |
| 2020 | $5,156 | $220,778 | $36,000 | $184,778 |
| 2019 | $4,738 | $205,021 | $34,000 | $171,021 |
| 2018 | $4,533 | $193,820 | $32,000 | $161,820 |
| 2017 | $4,367 | $186,923 | $32,000 | $154,923 |
| 2016 | $4,204 | $178,291 | $25,000 | $153,291 |
| 2015 | $4,191 | $172,112 | $25,000 | $147,112 |
| 2014 | $4,032 | $165,048 | $25,000 | $140,048 |
| 2012 | -- | $163,175 | $25,000 | $138,175 |
Source: Public Records
Map
Nearby Homes
- 2006 Diane St
- 2105 Petersen Dr
- 1806 Walnut Creek Dr
- 2010 Ridgeview Dr
- 2070 Stillwater Dr
- 2231 Crystal Creek Dr
- 1808 Southview Dr
- 2110 S Mineral Dr
- 2241 Glacier Dr
- 812 Lake Tahoe Dr
- 2404 Walnut Creek Dr
- 12001 S 90th St
- 814 Clearwater Dr
- 1704 Southview Dr
- 2421 Sand Hills Dr
- 501 Kent Dr
- 10506 Flint Dr
- 10502 Flint Dr
- 11859 S 105th Ave
- Lot 115 Ave Unit Lot 115
- 1122 Port Royal Dr
- 2004 Walnut Creek Dr
- 0 Port Royal Dr
- 1120 Port Royal Dr
- 2006 Walnut Creek Dr
- 2003 Walnut Creek Dr
- 1118 Port Royal Dr
- 2008 Walnut Creek Dr
- 2005 Walnut Creek Dr
- 1116 Port Royal Dr
- 2010 Walnut Creek Dr
- 2004 Diane St
- 1107 Edgewater Dr
- 2007 Walnut Creek Dr
- 1109 Edgewater Dr
- 1114 Port Royal Dr
- 2102 Walnut Creek Dr
- 1105 Edgewater Dr
- 2101 Walnut Creek Dr
- 2008 Diane St