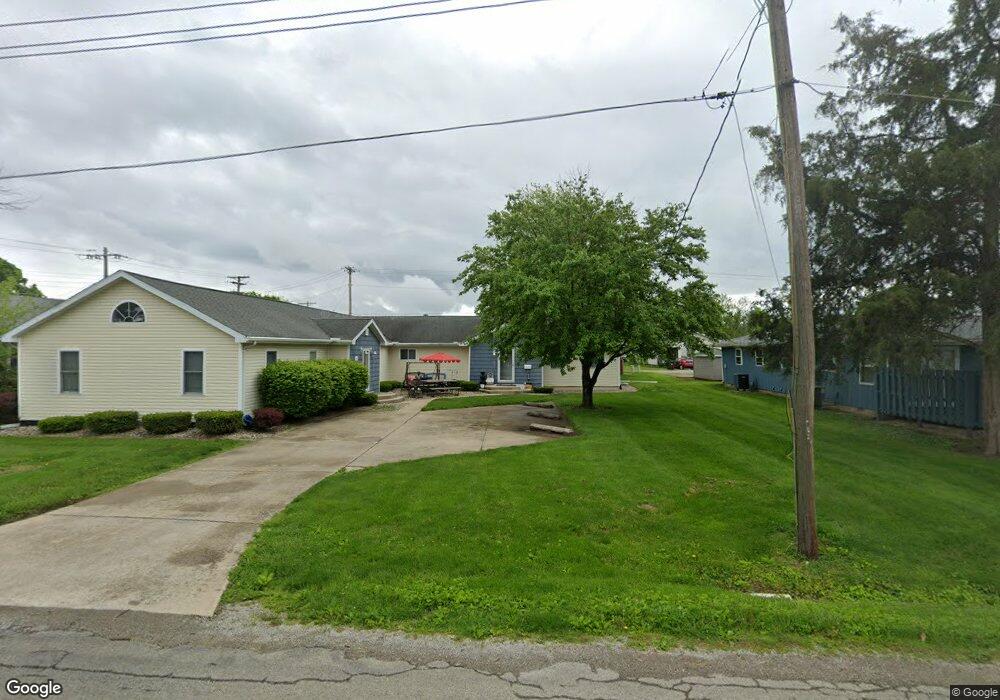
2003 11th St Charleston, IL 61920
Estimated Value: $181,000 - $269,000
3
Beds
2
Baths
3,274
Sq Ft
$68/Sq Ft
Est. Value
About This Home
This home is located at 2003 11th St, Charleston, IL 61920 and is currently estimated at $221,071, approximately $67 per square foot. 2003 11th St is a home located in Coles County with nearby schools including Charleston High School, Charleston Christian Academy, and Charleston Christian Academy High School.
Ownership History
Date
Name
Owned For
Owner Type
Purchase Details
Closed on
Jan 5, 2012
Sold by
First National Bank
Bought by
Zimmer Real Estate Rpoperties Llc
Current Estimated Value
Home Financials for this Owner
Home Financials are based on the most recent Mortgage that was taken out on this home.
Original Mortgage
$531,200
Interest Rate
4.75%
Mortgage Type
Purchase Money Mortgage
Create a Home Valuation Report for This Property
The Home Valuation Report is an in-depth analysis detailing your home's value as well as a comparison with similar homes in the area
Home Values in the Area
Average Home Value in this Area
Purchase History
| Date | Buyer | Sale Price | Title Company |
|---|---|---|---|
| Zimmer Real Estate Rpoperties Llc | $645,500 | None Available |
Source: Public Records
Mortgage History
| Date | Status | Borrower | Loan Amount |
|---|---|---|---|
| Closed | Zimmer Real Estate Rpoperties Llc | $531,200 |
Source: Public Records
Tax History Compared to Growth
Tax History
| Year | Tax Paid | Tax Assessment Tax Assessment Total Assessment is a certain percentage of the fair market value that is determined by local assessors to be the total taxable value of land and additions on the property. | Land | Improvement |
|---|---|---|---|---|
| 2024 | $5,026 | $64,765 | $8,122 | $56,643 |
| 2023 | $4,950 | $59,146 | $7,417 | $51,729 |
| 2022 | $4,959 | $58,168 | $7,294 | $50,874 |
| 2021 | $4,759 | $52,000 | $7,000 | $45,000 |
| 2020 | $4,842 | $53,878 | $6,790 | $47,088 |
| 2019 | $4,764 | $52,000 | $6,553 | $45,447 |
| 2018 | $4,713 | $52,000 | $6,553 | $45,447 |
| 2017 | $4,651 | $52,000 | $6,553 | $45,447 |
| 2016 | $4,611 | $52,000 | $6,553 | $45,447 |
| 2015 | $6,462 | $64,000 | $6,553 | $57,447 |
| 2014 | $6,462 | $70,581 | $6,553 | $64,028 |
| 2013 | $6,462 | $70,581 | $6,553 | $64,028 |
Source: Public Records
Map
Nearby Homes
- 950 Edgar Dr Unit 4
- 2536 Salem Rd
- 1125 6th St
- 1103 & 1105 6th St
- 2162 Hidden Lake Ct
- 1011 6th St
- 1528 Division St
- 6 Brosam Dr
- 9 Brosam Dr
- 27 Heather Dr
- 9 Orchard Dr
- 124 Polk Ave
- 943 2nd St
- 1520 Harrison Ave
- Lot 28 Tanglewood Dr
- Lot 35 Tanglewood Dr
- Lot 41 Hawthorne Dr
- Lot 43 Hawthorne Dr
- Lot 45 Hawthorne Dr
- Lot 47 Hawthorne Dr