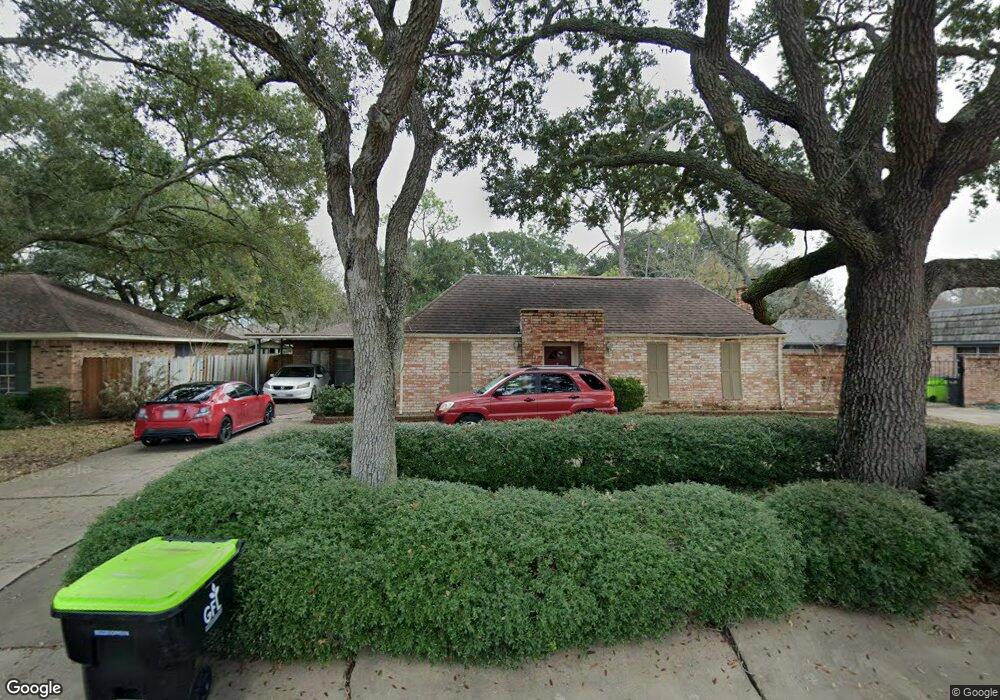
2003 Briar Ln Richmond, TX 77469
Estimated Value: $289,000 - $346,000
3
Beds
2
Baths
2,549
Sq Ft
$121/Sq Ft
Est. Value
About This Home
This home is located at 2003 Briar Ln, Richmond, TX 77469 and is currently estimated at $307,648, approximately $120 per square foot. 2003 Briar Ln is a home located in Fort Bend County with nearby schools including Jane Long Elementary School, J J Wessendorff Middle School, and Lamar Junior High School.
Ownership History
Date
Name
Owned For
Owner Type
Purchase Details
Closed on
May 22, 2024
Sold by
Garcia Carlos A and Garcia Charles A
Bought by
Garcia Helene M
Current Estimated Value
Purchase Details
Closed on
Jan 15, 2002
Sold by
Beard William J and Beard Judith A
Bought by
Garcia Helene M and Garcia Charles A
Home Financials for this Owner
Home Financials are based on the most recent Mortgage that was taken out on this home.
Original Mortgage
$126,976
Interest Rate
6.8%
Mortgage Type
FHA
Purchase Details
Closed on
Jan 9, 2002
Sold by
Beard William J and Beard Judith A
Bought by
Garcia Charles A and Garcia Helene M
Home Financials for this Owner
Home Financials are based on the most recent Mortgage that was taken out on this home.
Original Mortgage
$126,976
Interest Rate
6.8%
Mortgage Type
FHA
Purchase Details
Closed on
Jun 17, 1995
Sold by
Folmar Patricia Ann
Bought by
Beard William J and Beard Judith A
Create a Home Valuation Report for This Property
The Home Valuation Report is an in-depth analysis detailing your home's value as well as a comparison with similar homes in the area
Home Values in the Area
Average Home Value in this Area
Purchase History
| Date | Buyer | Sale Price | Title Company |
|---|---|---|---|
| Garcia Helene M | -- | None Listed On Document | |
| Garcia Helene M | -- | -- | |
| Garcia Charles A | -- | First American Title Ins Co | |
| Beard William J | -- | American Title Company |
Source: Public Records
Mortgage History
| Date | Status | Borrower | Loan Amount |
|---|---|---|---|
| Previous Owner | Garcia Charles A | $126,976 |
Source: Public Records
Tax History Compared to Growth
Tax History
| Year | Tax Paid | Tax Assessment Tax Assessment Total Assessment is a certain percentage of the fair market value that is determined by local assessors to be the total taxable value of land and additions on the property. | Land | Improvement |
|---|---|---|---|---|
| 2025 | $4,010 | $275,116 | $23,175 | $251,941 |
| 2024 | $4,010 | $286,927 | $14,284 | $272,643 |
| 2023 | $3,825 | $260,843 | $0 | $269,777 |
| 2022 | $4,836 | $237,130 | $0 | $280,950 |
| 2021 | $5,119 | $215,570 | $23,180 | $192,390 |
| 2020 | $5,233 | $217,140 | $23,180 | $193,960 |
| 2019 | $5,112 | $200,180 | $23,180 | $177,000 |
| 2018 | $4,675 | $181,980 | $23,180 | $158,800 |
| 2017 | $4,592 | $176,680 | $23,180 | $153,500 |
| 2016 | $4,298 | $165,380 | $23,180 | $142,200 |
| 2015 | $3,650 | $157,770 | $23,180 | $134,590 |
| 2014 | $3,520 | $145,880 | $23,180 | $122,700 |
Source: Public Records
Map
Nearby Homes
- 2001 Briar Ln
- 0 Meadow Ln
- 2015 Tanglelane St
- 406 Fairway Dr
- 805 Chateau Place
- 1004 Country Club Dr
- 201 Hillcrest Dr
- 400 Hillcrest Dr
- 7315 Audubon Russet Dr
- 7322 Audubon Russet Dr
- 2143 Alabaster Estate Dr
- 2236 Par Ln
- 1810 Winston Store Loop
- 1911 Winston Store Loop
- 24007 Barnett Overlook
- 0 Fm 2218 Unit 25550047
- 606 Fannin St
- 1922 Teakwood St
- 2008 Golden Creek Ln
- 505 Austin St