Estimated Value: $628,000 - $696,000
4
Beds
3
Baths
2,649
Sq Ft
$249/Sq Ft
Est. Value
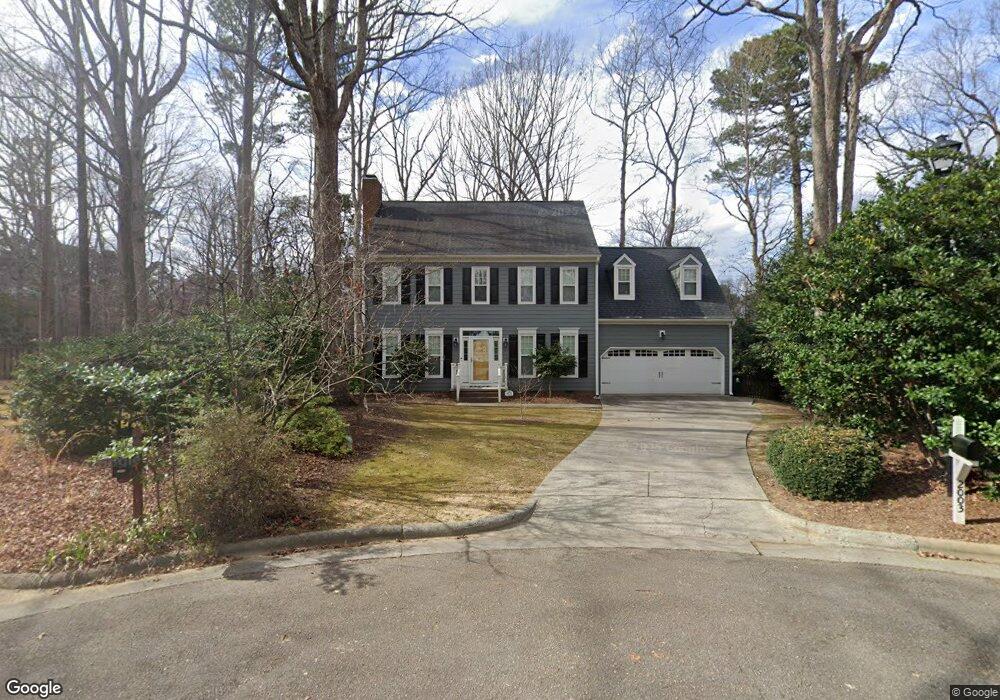
About This Home
This home is located at 2003 Charington Ct, Apex, NC 27502 and is currently estimated at $658,736, approximately $248 per square foot. 2003 Charington Ct is a home located in Wake County with nearby schools including Apex Elementary School, Apex Middle, and Apex High School.
Ownership History
Date
Name
Owned For
Owner Type
Purchase Details
Closed on
Oct 11, 2017
Sold by
Ray Steven K and Ray Stefanie R
Bought by
Swanson Ryan S and Swanson Kristina Gladden
Current Estimated Value
Home Financials for this Owner
Home Financials are based on the most recent Mortgage that was taken out on this home.
Original Mortgage
$360,905
Outstanding Balance
$301,133
Interest Rate
3.78%
Mortgage Type
New Conventional
Estimated Equity
$357,603
Purchase Details
Closed on
Jan 31, 2016
Sold by
Lewis Keith D and Lewis Mary Jane
Bought by
Ray Steven K and Ray Stefanie R
Home Financials for this Owner
Home Financials are based on the most recent Mortgage that was taken out on this home.
Original Mortgage
$362,000
Interest Rate
4.16%
Mortgage Type
New Conventional
Purchase Details
Closed on
May 31, 1991
Bought by
Lewis Keith D and Mary Jane
Create a Home Valuation Report for This Property
The Home Valuation Report is an in-depth analysis detailing your home's value as well as a comparison with similar homes in the area
Purchase History
| Date | Buyer | Sale Price | Title Company |
|---|---|---|---|
| Swanson Ryan S | $380,000 | None Available | |
| Ray Steven K | $362,000 | None Available | |
| Lewis Keith D | $173,000 | -- |
Source: Public Records
Mortgage History
| Date | Status | Borrower | Loan Amount |
|---|---|---|---|
| Open | Swanson Ryan S | $360,905 | |
| Previous Owner | Ray Steven K | $362,000 |
Source: Public Records
Tax History
| Year | Tax Paid | Tax Assessment Tax Assessment Total Assessment is a certain percentage of the fair market value that is determined by local assessors to be the total taxable value of land and additions on the property. | Land | Improvement |
|---|---|---|---|---|
| 2025 | $5,227 | $596,360 | $200,000 | $396,360 |
| 2024 | $5,110 | $596,360 | $200,000 | $396,360 |
Source: Public Records
Map
Nearby Homes
- 117 Altair Cir
- 119 Heatherwood Dr
- 1200 Boxwood Ln
- 514 Mill Hopper Ln
- 2282 Apex Peakway
- 2284 Apex Peakway
- 345 Great Northern Station
- 2286 Apex Peakway
- 2288 Apex Peakway
- 2290 Apex Peakway
- 2292 Apex Peakway
- 631 Sawcut Ln
- 635 Sawcut Ln
- 633 Sawcut Ln
- 2294 Apex Peakway
- 2296 Apex Peakway
- 2365 Englemann Dr Unit Lot 129
- 3123 June Lake Station Unit Lot 215
- 2361 Englemann Dr
- 2374 Englemann Dr
- 3007 New Yarmouth Way
- 1018 New Dover Rd
- 3005 New Yarmouth Way
- 3009 New Yarmouth Way
- 1020 New Dover Rd
- 2004 Charington Ct
- 3011 New Yarmouth Way
- 2002 Charington Ct
- 1022 New Dover Rd
- 3003 New Yarmouth Way
- 1014 Chickering Ct
- 3013 New Yarmouth Way
- 1024 New Dover Rd
- 2007 Bridgeham Way
- 3001 New Yarmouth Way
- 3006 New Yarmouth Way
- 1017 New Dover Rd
- 1019 New Dover Rd
- 3008 New Yarmouth Way
- 2009 Bridgeham Way
Your Personal Tour Guide
Ask me questions while you tour the home.