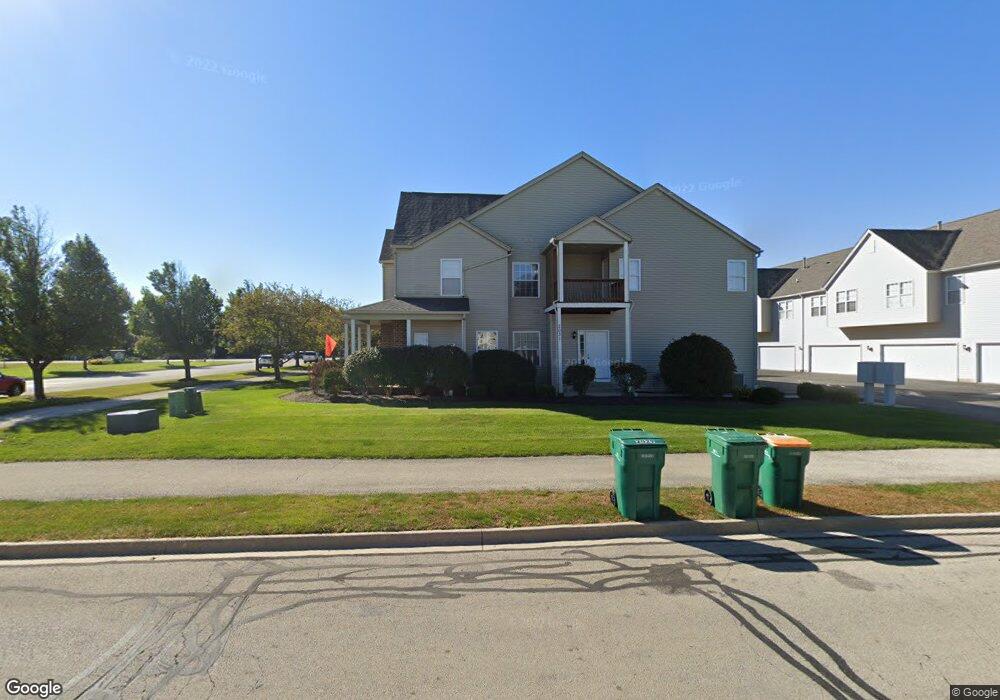
2003 Frantum Rd Sycamore, IL 60178
Estimated Value: $210,000 - $238,000
2
Beds
6
Baths
639
Sq Ft
$347/Sq Ft
Est. Value
About This Home
This home is located at 2003 Frantum Rd, Sycamore, IL 60178 and is currently estimated at $221,667, approximately $346 per square foot. 2003 Frantum Rd is a home located in DeKalb County with nearby schools including Sycamore High School, St Mary's Catholic School, and Cornerstone Christian Academy.
Ownership History
Date
Name
Owned For
Owner Type
Purchase Details
Closed on
Aug 15, 2023
Sold by
Finnan Patrick J and Finnan Betsy A
Bought by
Malley Meghan L
Current Estimated Value
Home Financials for this Owner
Home Financials are based on the most recent Mortgage that was taken out on this home.
Original Mortgage
$10,000
Outstanding Balance
$2,141
Interest Rate
6.96%
Estimated Equity
$219,526
Purchase Details
Closed on
Feb 28, 2019
Sold by
Hunter Kevin Michael and Hunter Kristine Emily
Bought by
Finnan Patrick J and Finnan Betsey A
Home Financials for this Owner
Home Financials are based on the most recent Mortgage that was taken out on this home.
Original Mortgage
$128,900
Interest Rate
4.5%
Mortgage Type
New Conventional
Purchase Details
Closed on
Jun 20, 2017
Sold by
Burns Bradley R
Bought by
Hunter Kevin Michael
Purchase Details
Closed on
Aug 11, 2016
Sold by
Burns Russell E
Bought by
Burns Bradley R
Purchase Details
Closed on
May 25, 2007
Sold by
Belz Martin E
Bought by
Smith Jonathan L
Home Financials for this Owner
Home Financials are based on the most recent Mortgage that was taken out on this home.
Original Mortgage
$156,750
Interest Rate
6.22%
Mortgage Type
New Conventional
Create a Home Valuation Report for This Property
The Home Valuation Report is an in-depth analysis detailing your home's value as well as a comparison with similar homes in the area
Home Values in the Area
Average Home Value in this Area
Purchase History
| Date | Buyer | Sale Price | Title Company |
|---|---|---|---|
| Malley Meghan L | $205,000 | None Listed On Document | |
| Finnan Patrick J | $149,000 | None Available | |
| Hunter Kevin Michael | $149,500 | None Available | |
| Burns Bradley R | -- | -- | |
| Burns Russell E | -- | -- | |
| Smith Jonathan L | $165,000 | -- |
Source: Public Records
Mortgage History
| Date | Status | Borrower | Loan Amount |
|---|---|---|---|
| Open | Malley Meghan L | $10,000 | |
| Open | Malley Meghan L | $194,750 | |
| Previous Owner | Finnan Patrick J | $128,900 | |
| Previous Owner | Smith Jonathan L | $156,750 |
Source: Public Records
Tax History Compared to Growth
Tax History
| Year | Tax Paid | Tax Assessment Tax Assessment Total Assessment is a certain percentage of the fair market value that is determined by local assessors to be the total taxable value of land and additions on the property. | Land | Improvement |
|---|---|---|---|---|
| 2024 | $4,773 | $64,351 | $13,656 | $50,695 |
| 2023 | $4,773 | $58,763 | $12,470 | $46,293 |
| 2022 | $4,539 | $53,896 | $11,437 | $42,459 |
| 2021 | $4,303 | $50,597 | $10,737 | $39,860 |
| 2020 | $4,236 | $49,353 | $10,473 | $38,880 |
| 2019 | $4,161 | $48,272 | $10,244 | $38,028 |
| 2018 | $4,657 | $52,571 | $9,933 | $42,638 |
| 2017 | $5,143 | $50,491 | $9,540 | $40,951 |
| 2016 | $5,037 | $48,188 | $9,105 | $39,083 |
| 2015 | -- | $45,353 | $8,569 | $36,784 |
| 2014 | -- | $43,066 | $8,137 | $34,929 |
| 2013 | -- | $43,891 | $8,293 | $35,598 |
Source: Public Records
Map
Nearby Homes
- 585 Clayton Cir Unit C
- Lot43 Heron Creek Es Letha Westgate Dr
- 639 Stonegate Dr
- Lot 97 Merry Oaks Dr
- Lot 86 Merry Oaks Dr
- 169 Plank Rd
- 223 Merry Oaks Dr
- 209 Whittemore Dr
- 218 Whittemore Dr
- 233 Whittemore Dr
- 224 Whittemore Dr
- 1360 Florence Dr
- 700 Susan St
- Rt 23 and Plank Rd Rt 23 and Plank Rd Rd
- 24 Kloe Ln Unit 24
- 68 Kloe Ln Unit 68
- 1308 Axcel Ln
- 513 Amherst Dr
- Cypress Plan at North Grove Crossings
- Hawthorn Plan at North Grove Crossings
- 2005 Frantum Rd
- 2003 Frantum Rd Unit C
- 2007 Frantum Rd
- 2001 Frantum Rd Unit D
- 2001 Frantum Rd
- 2021 Frantum Rd
- 2021 Frantum Rd Unit B
- 2023 Frantum Rd
- 2023 Frantum Rd Unit D
- 2025 Frantum Rd
- 2031 Frantum Rd
- 2027 Frantum Rd
- 2003C Frantum Rd
- 520 Clayton Cir
- 518 Clayton Cir
- 475 Olin h Smith Dr
- 542 Clayton Cir
- 530 Clayton Cir
- 514 Clayton Cir
- 532 Clayton Cir