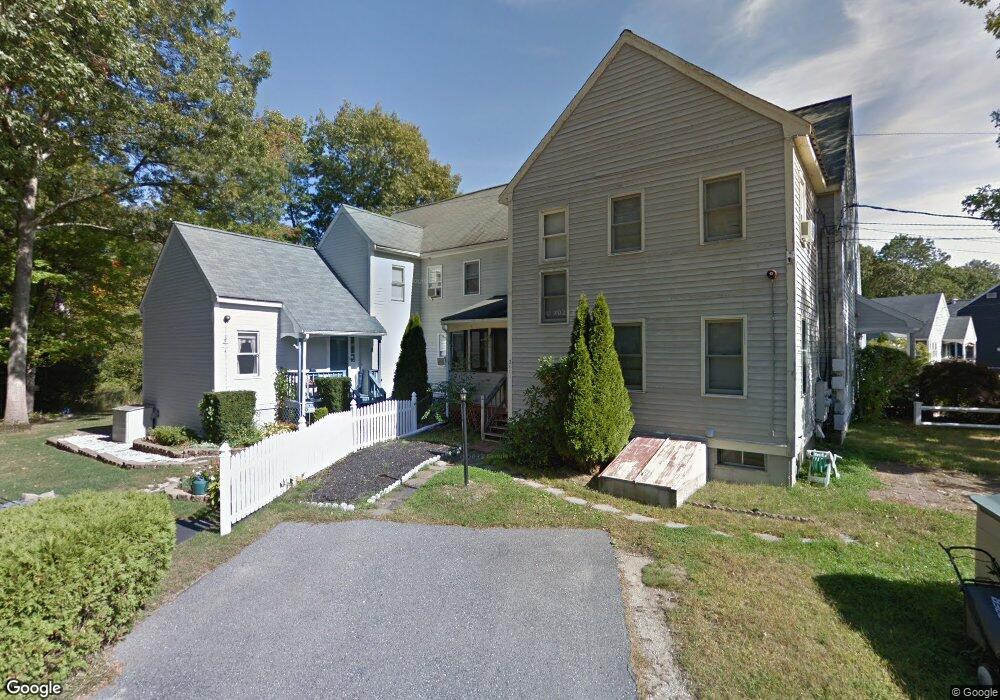
2003 Lords Ct Wilmington, MA 01887
Estimated Value: $329,000 - $620,000
3
Beds
2
Baths
1,472
Sq Ft
$331/Sq Ft
Est. Value
About This Home
This home is located at 2003 Lords Ct, Wilmington, MA 01887 and is currently estimated at $487,911, approximately $331 per square foot. 2003 Lords Ct is a home located in Middlesex County with nearby schools including Wilmington Middle School, Wilmington High School, and Abundant Life Christian School and Childcare.
Ownership History
Date
Name
Owned For
Owner Type
Purchase Details
Closed on
Aug 27, 1991
Sold by
Shawsheen River Est Ld
Bought by
Turner Glenn R
Current Estimated Value
Create a Home Valuation Report for This Property
The Home Valuation Report is an in-depth analysis detailing your home's value as well as a comparison with similar homes in the area
Home Values in the Area
Average Home Value in this Area
Purchase History
| Date | Buyer | Sale Price | Title Company |
|---|---|---|---|
| Turner Glenn R | $62,000 | -- |
Source: Public Records
Mortgage History
| Date | Status | Borrower | Loan Amount |
|---|---|---|---|
| Open | Turner Glenn R | $110,000 | |
| Closed | Turner Glenn R | $25,000 | |
| Closed | Turner Glenn R | $75,000 | |
| Closed | Turner Glenn R | $15,000 |
Source: Public Records
Tax History Compared to Growth
Tax History
| Year | Tax Paid | Tax Assessment Tax Assessment Total Assessment is a certain percentage of the fair market value that is determined by local assessors to be the total taxable value of land and additions on the property. | Land | Improvement |
|---|---|---|---|---|
| 2025 | $2,911 | $254,200 | $126,200 | $128,000 |
| 2024 | $2,832 | $247,800 | $126,200 | $121,600 |
| 2023 | $2,702 | $226,300 | $114,700 | $111,600 |
| 2022 | $2,684 | $206,000 | $95,600 | $110,400 |
| 2021 | $2,606 | $188,300 | $86,900 | $101,400 |
| 2020 | $3,016 | $222,100 | $170,400 | $51,700 |
| 2019 | $3,054 | $222,100 | $162,300 | $59,800 |
| 2018 | $3,200 | $222,100 | $154,500 | $67,600 |
| 2017 | $3,209 | $222,100 | $147,200 | $74,900 |
| 2016 | $3,131 | $214,000 | $140,100 | $73,900 |
| 2015 | $2,021 | $140,675 | $140,100 | $575 |
| 2014 | $2,003 | $140,675 | $133,500 | $7,175 |
Source: Public Records
Map
Nearby Homes