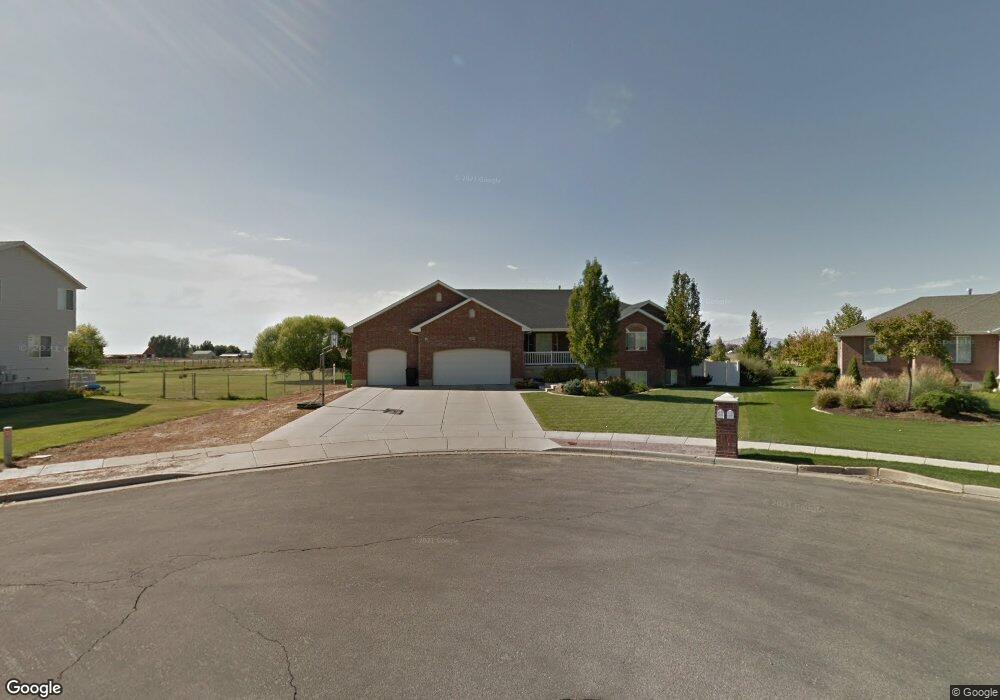
2003 N 3675 W Clearfield, UT 84015
Estimated Value: $631,000 - $837,378
4
Beds
4
Baths
2,222
Sq Ft
$345/Sq Ft
Est. Value
About This Home
This home is located at 2003 N 3675 W, Clearfield, UT 84015 and is currently estimated at $767,095, approximately $345 per square foot. 2003 N 3675 W is a home located in Davis County with nearby schools including West Point School, West Point Junior High School, and Syracuse High School.
Ownership History
Date
Name
Owned For
Owner Type
Purchase Details
Closed on
Jun 18, 2003
Sold by
Carlson Steven
Bought by
Carlson Steven and Carlson Paula
Current Estimated Value
Purchase Details
Closed on
May 27, 2003
Sold by
Carlson Paula
Bought by
Carlson Steven
Purchase Details
Closed on
May 11, 2000
Sold by
Craythorne Construction Company Inc
Bought by
Carlson Steven and Carlson Paula
Home Financials for this Owner
Home Financials are based on the most recent Mortgage that was taken out on this home.
Original Mortgage
$40,125
Outstanding Balance
$13,737
Interest Rate
8.22%
Estimated Equity
$753,358
Purchase Details
Closed on
Apr 28, 1999
Sold by
Weaver Donadl W and Weaver Marilyn A
Bought by
Craythorne Construction Company Inc
Purchase Details
Closed on
Jun 13, 1996
Sold by
Vankomen Robert H
Bought by
Weaver Donald W and Weaver Marilyn A
Create a Home Valuation Report for This Property
The Home Valuation Report is an in-depth analysis detailing your home's value as well as a comparison with similar homes in the area
Home Values in the Area
Average Home Value in this Area
Purchase History
| Date | Buyer | Sale Price | Title Company |
|---|---|---|---|
| Carlson Steven | -- | Founders Title Co | |
| Carlson Steven | -- | Founders Title Co | |
| Carlson Steven | -- | Bonneville Title Company Inc | |
| Craythorne Construction Company Inc | -- | Bonneville Title Company Inc | |
| Weaver Donald W | -- | Bonneville Title Company Inc |
Source: Public Records
Mortgage History
| Date | Status | Borrower | Loan Amount |
|---|---|---|---|
| Open | Carlson Steven | $40,125 |
Source: Public Records
Tax History Compared to Growth
Tax History
| Year | Tax Paid | Tax Assessment Tax Assessment Total Assessment is a certain percentage of the fair market value that is determined by local assessors to be the total taxable value of land and additions on the property. | Land | Improvement |
|---|---|---|---|---|
| 2025 | $4,858 | $455,250 | $194,389 | $260,861 |
| 2024 | $4,521 | $425,525 | $173,900 | $251,625 |
| 2023 | $4,297 | $734,000 | $235,553 | $498,447 |
| 2022 | $4,688 | $438,900 | $130,634 | $308,266 |
| 2021 | $4,390 | $615,000 | $173,687 | $441,313 |
| 2020 | $3,828 | $530,000 | $150,129 | $379,871 |
| 2019 | $3,651 | $497,000 | $145,683 | $351,317 |
| 2018 | $3,446 | $463,000 | $133,678 | $329,322 |
| 2016 | $3,092 | $221,239 | $55,595 | $165,644 |
| 2015 | $2,953 | $200,229 | $55,595 | $144,634 |
| 2014 | $2,812 | $193,343 | $54,805 | $138,538 |
| 2013 | -- | $155,243 | $48,674 | $106,569 |
Source: Public Records
Map
Nearby Homes
- 3656 W 1800 N
- 2118 Snowy Crane Dr
- Torino Farmhouse Plan at Cranefield Estates
- 2000 Traditional Plan at Cranefield Estates - Estates Collection
- Murano Traditional Plan at Cranefield Estates - Estates Collection
- 2400 Farmhouse Plan at Cranefield Estates - Estates Collection
- 1825 Traditional Plan at Cranefield Estates - Estates Collection
- 1550 Craftsman Plan at Cranefield Estates - Estates Collection
- 2050 Craftsman Plan at Cranefield Estates - Estates Collection
- Murano Traditional Plan at Cranefield Estates
- San Marino Traditional Plan at Cranefield Estates
- 3000 Traditional Plan at Cranefield Estates - Estates Collection
- 2000 Farmhouse Plan at Cranefield Estates - Estates Collection
- 2500 Traditional Plan at Cranefield Estates - Estates Collection
- 2000 Garden Plan at Cranefield Estates - Estates Collection
- 3762 W 2300 N
- 2413 N Eurasian Crane Rd
- 2444 N Hooded Crane Cir Unit 11
- 2462 N Hooded Crane Ct
- 2444 N Stanley Crane Dr