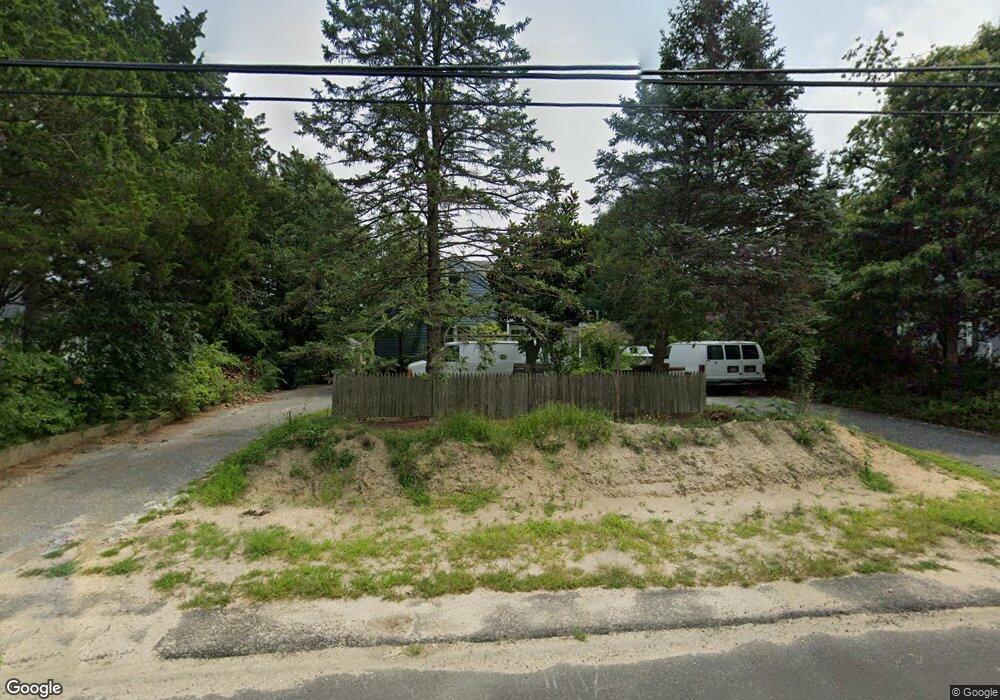
2003 Route 9 Ocean View, NJ 08230
Estimated Value: $598,372 - $680,000
3
Beds
4
Baths
2,838
Sq Ft
$228/Sq Ft
Est. Value
About This Home
This home is located at 2003 Route 9, Ocean View, NJ 08230 and is currently estimated at $646,093, approximately $227 per square foot. 2003 Route 9 is a home located in Cape May County with nearby schools including Upper Township Primary School, Upper Township Elementary School, and Upper Township Middle School.
Ownership History
Date
Name
Owned For
Owner Type
Purchase Details
Closed on
Sep 20, 2005
Sold by
Oliver Jolu and Oliver Anthony
Bought by
Young Donald
Current Estimated Value
Home Financials for this Owner
Home Financials are based on the most recent Mortgage that was taken out on this home.
Original Mortgage
$29,000
Outstanding Balance
$15,705
Interest Rate
5.85%
Mortgage Type
Credit Line Revolving
Estimated Equity
$630,388
Purchase Details
Closed on
Jul 30, 2003
Sold by
Oliver Jolu
Bought by
Oliver Jolu
Create a Home Valuation Report for This Property
The Home Valuation Report is an in-depth analysis detailing your home's value as well as a comparison with similar homes in the area
Home Values in the Area
Average Home Value in this Area
Purchase History
| Date | Buyer | Sale Price | Title Company |
|---|---|---|---|
| Young Donald | $290,000 | Group 21 Title Agency | |
| Oliver Jolu | -- | -- |
Source: Public Records
Mortgage History
| Date | Status | Borrower | Loan Amount |
|---|---|---|---|
| Open | Young Donald | $29,000 | |
| Previous Owner | Young Donald | $232,000 |
Source: Public Records
Tax History Compared to Growth
Tax History
| Year | Tax Paid | Tax Assessment Tax Assessment Total Assessment is a certain percentage of the fair market value that is determined by local assessors to be the total taxable value of land and additions on the property. | Land | Improvement |
|---|---|---|---|---|
| 2025 | $6,456 | $281,300 | $105,000 | $176,300 |
| 2024 | $6,456 | $281,300 | $105,000 | $176,300 |
| 2023 | $6,138 | $281,300 | $105,000 | $176,300 |
| 2022 | $5,933 | $281,300 | $105,000 | $176,300 |
| 2021 | $3,785 | $281,300 | $105,000 | $176,300 |
| 2020 | $5,508 | $281,300 | $105,000 | $176,300 |
| 2019 | $5,376 | $281,300 | $105,000 | $176,300 |
| 2018 | $5,238 | $281,300 | $105,000 | $176,300 |
| 2017 | $5,179 | $281,300 | $105,000 | $176,300 |
| 2016 | $4,555 | $243,600 | $105,000 | $138,600 |
| 2015 | $4,436 | $243,600 | $105,000 | $138,600 |
| 2014 | $4,443 | $298,800 | $148,900 | $149,900 |
Source: Public Records
Map
Nearby Homes