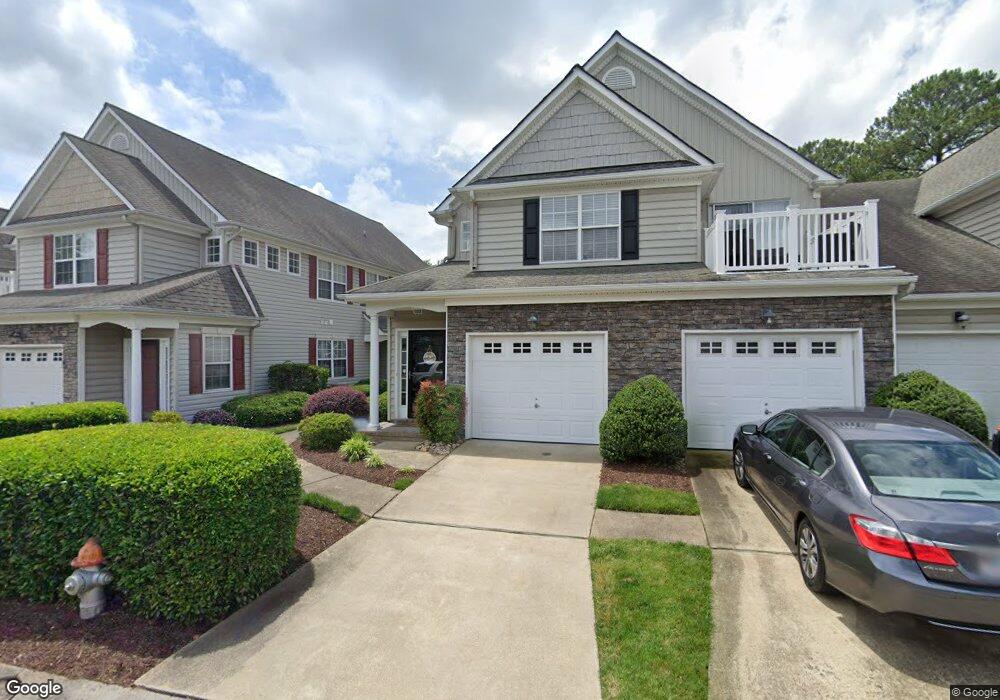
2003 Sawgrass Ln Portsmouth, VA 23703
Churchland NeighborhoodEstimated Value: $259,000 - $280,000
3
Beds
2
Baths
1,646
Sq Ft
$166/Sq Ft
Est. Value
About This Home
This home is located at 2003 Sawgrass Ln, Portsmouth, VA 23703 and is currently estimated at $272,737, approximately $165 per square foot. 2003 Sawgrass Ln is a home located in Portsmouth City with nearby schools including Churchland Academy Elementary School, Churchland Elementary School, and Churchland Middle School.
Ownership History
Date
Name
Owned For
Owner Type
Purchase Details
Closed on
Oct 12, 2020
Sold by
Sims Maryann A
Bought by
Brown Latoya M
Current Estimated Value
Home Financials for this Owner
Home Financials are based on the most recent Mortgage that was taken out on this home.
Original Mortgage
$191,467
Outstanding Balance
$169,599
Interest Rate
2.8%
Mortgage Type
FHA
Estimated Equity
$103,138
Purchase Details
Closed on
Jun 1, 2016
Sold by
Streeter Karen L
Bought by
Sims Maryann A
Home Financials for this Owner
Home Financials are based on the most recent Mortgage that was taken out on this home.
Original Mortgage
$148,755
Interest Rate
3.37%
Mortgage Type
FHA
Purchase Details
Closed on
Sep 27, 2004
Sold by
River Pointe Assocs L L C
Bought by
Streeter Karen L
Home Financials for this Owner
Home Financials are based on the most recent Mortgage that was taken out on this home.
Original Mortgage
$171,210
Interest Rate
5.81%
Mortgage Type
FHA
Create a Home Valuation Report for This Property
The Home Valuation Report is an in-depth analysis detailing your home's value as well as a comparison with similar homes in the area
Home Values in the Area
Average Home Value in this Area
Purchase History
| Date | Buyer | Sale Price | Title Company |
|---|---|---|---|
| Brown Latoya M | $194,999 | Vintage Title & Escrow | |
| Sims Maryann A | $151,500 | Virginia Home Title & Stlmnt | |
| Streeter Karen L | $176,505 | -- |
Source: Public Records
Mortgage History
| Date | Status | Borrower | Loan Amount |
|---|---|---|---|
| Open | Brown Latoya M | $191,467 | |
| Previous Owner | Sims Maryann A | $148,755 | |
| Previous Owner | Streeter Karen L | $171,210 |
Source: Public Records
Tax History Compared to Growth
Tax History
| Year | Tax Paid | Tax Assessment Tax Assessment Total Assessment is a certain percentage of the fair market value that is determined by local assessors to be the total taxable value of land and additions on the property. | Land | Improvement |
|---|---|---|---|---|
| 2025 | $3,081 | $261,140 | $60,000 | $201,140 |
| 2024 | $3,081 | $236,570 | $60,000 | $176,570 |
| 2023 | $2,708 | $216,610 | $60,000 | $156,610 |
| 2022 | $2,511 | $193,180 | $55,000 | $138,180 |
| 2021 | $2,251 | $173,180 | $35,000 | $138,180 |
| 2020 | $2,072 | $159,370 | $35,000 | $124,370 |
| 2019 | $2,072 | $159,370 | $35,000 | $124,370 |
| 2018 | $2,072 | $159,370 | $35,000 | $124,370 |
| 2017 | $2,072 | $159,370 | $35,000 | $124,370 |
| 2016 | $2,256 | $173,570 | $35,000 | $138,570 |
| 2015 | $2,256 | $173,570 | $35,000 | $138,570 |
| 2014 | $2,204 | $173,570 | $35,000 | $138,570 |
Source: Public Records
Map
Nearby Homes
- 2004 Sawgrass Ln
- 3609 Loon Ct
- 3609 Linnet Ln
- 3832 New River Reach Unit A
- 3812 Falling River Reach Unit C
- 6 Waterview Ct
- 4412 Carlton Ct
- 50 Centre Port Cir
- 3614 Jordan Ln
- 4613 Mallard Crescent
- 3613 Cardinal Ln
- 17 Centre Port Cir
- 4808 Thornwood St
- 3728 Cardinal Ln
- 1068 Estates Ct
- 122 Keeper St Unit 86
- 4239 Hatton Point Ln Unit 35
- 4257 Hatton Point Ln Unit 44
- 137 Lighthouse Dr
- 109 Fresnel Ave Unit 124
- 2002 Sawgrass Ln
- 2002 Sawgrass Ln Unit 2002
- 2102 Sawgrass Ln
- 2101 Sawgrass Ln
- 2001 Sawgrass Ln
- 2103 Sawgrass Ln
- 202 Sawgrass Ln
- 2104 Sawgrass Ln
- 2213 Sawgrass Ln
- 1904 Sawgrass Ln
- 104 Sawgrass Ln
- 104 Sawgrass Ln Unit 1-104
- 204 Sawgrass Ln
- 103 Sawgrass Ln
- 201 Sawgrass Ln
- 2105 Sawgrass Ln
- 2105 Sawgrass Ln Unit 1-2105
- 2106 Sawgrass Ln
- 2106 Sawgrass Ln Unit 1-2106
- 2217 Sawgrass Ln