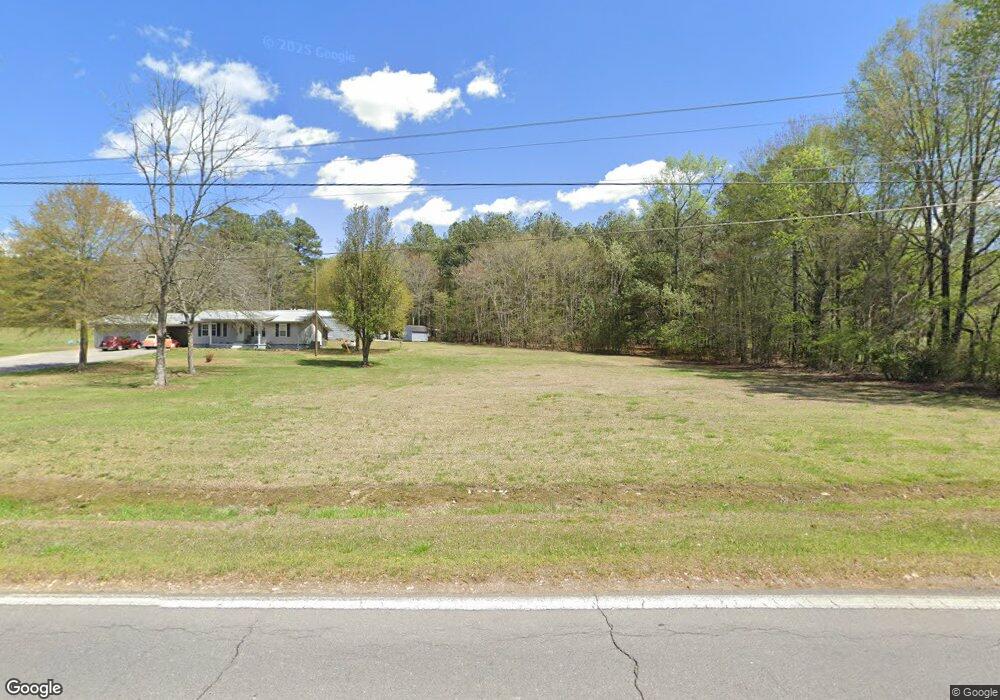
2003 Utility Rd Rocky Face, GA 30740
Estimated Value: $223,000 - $343,000
Studio
1
Bath
1,040
Sq Ft
$252/Sq Ft
Est. Value
About This Home
This home is located at 2003 Utility Rd, Rocky Face, GA 30740 and is currently estimated at $261,971, approximately $251 per square foot. 2003 Utility Rd is a home located in Whitfield County with nearby schools including Westside Elementary School, Westside Middle School, and Northwest Whitfield County High School.
Ownership History
Date
Name
Owned For
Owner Type
Purchase Details
Closed on
Mar 30, 2025
Sold by
Dobson James G
Bought by
Carlock Stacle L and Dobson James Gary
Current Estimated Value
Purchase Details
Closed on
Dec 28, 2019
Sold by
Carlock Stacie L
Bought by
Carlock Stacie G
Purchase Details
Closed on
Nov 21, 2018
Sold by
Dobson Robert
Bought by
Dobson James G
Purchase Details
Closed on
Jul 10, 2018
Sold by
Dobson Michael
Bought by
Dobson Robert and Dobson Dobson
Purchase Details
Closed on
Dec 28, 2013
Sold by
Dobson Monda Lynn
Bought by
Carlock Stacie Lynn
Purchase Details
Closed on
Nov 12, 2013
Sold by
Dobson Michael
Bought by
Dobson Monda Lynn and Carlock Stacie
Purchase Details
Closed on
Oct 28, 2005
Sold by
Not Provided
Bought by
Dobson Irene M
Purchase Details
Closed on
Sep 30, 2005
Sold by
Not Provided
Bought by
Dobson Irene M
Purchase Details
Closed on
Sep 1, 1998
Bought by
Dobson Michael
Create a Home Valuation Report for This Property
The Home Valuation Report is an in-depth analysis detailing your home's value as well as a comparison with similar homes in the area
Purchase History
| Date | Buyer | Sale Price | Title Company |
|---|---|---|---|
| Carlock Stacle L | -- | None Listed On Document | |
| Carlock Stacie L | -- | None Listed On Document | |
| Carlock Stacie G | -- | -- | |
| Dobson James G | -- | -- | |
| Dobson Robert | -- | -- | |
| Carlock Stacie Lynn | -- | -- | |
| Dobson Monda Lynn | -- | -- | |
| Dobson Irene M | -- | -- | |
| Dobson Irene M | -- | -- | |
| Dobson Michael | $10,000 | -- |
Source: Public Records
Tax History
| Year | Tax Paid | Tax Assessment Tax Assessment Total Assessment is a certain percentage of the fair market value that is determined by local assessors to be the total taxable value of land and additions on the property. | Land | Improvement |
|---|---|---|---|---|
| 2025 | $738 | $104,897 | $38,451 | $66,446 |
| 2024 | $738 | $104,897 | $38,451 | $66,446 |
| 2023 | $603 | $67,989 | $26,100 | $41,889 |
| 2022 | $330 | $50,749 | $22,000 | $28,749 |
| 2021 | $331 | $50,749 | $22,000 | $28,749 |
| 2020 | $337 | $48,667 | $19,918 | $28,749 |
| 2019 | $791 | $34,629 | $5,880 | $28,749 |
| 2018 | $761 | $33,444 | $4,695 | $28,749 |
| 2017 | $761 | $33,444 | $4,695 | $28,749 |
| 2016 | $666 | $30,842 | $4,695 | $26,147 |
| 2014 | -- | $30,903 | $4,756 | $26,147 |
| 2013 | -- | $30,903 | $4,756 | $26,147 |
Source: Public Records
Map
Nearby Homes
- 2015 Westin Way
- 0 Utility Southwest Rd Unit 1530245
- 272 Old Utility Rd
- 3365 Crider Rd
- 3149 Old Crider Rd
- 810 Mill Creek Rd
- 626 Lafayette Rd
- 00 Crider Rd
- 0 Buckingham Way
- 541 Deck Dr
- Lot 6 Eden Park Dr
- Lot 5 Eden Park Dr
- 2013 Deer Crossing
- 3231 Leona Dr
- lot 4 Deer Crossing
- Lot 15 Lamory Ln
- 3218 Leona Dr
- 0 Bluff View Trace
- Lot 20 Plum St
- Lot 21 Plum St
- 2003 Utility Rd
- 1995 Utility Rd
- 1981 Utility Rd
- 171 Miracle Dr
- 2035 Utility Rd
- 1957 Utility Rd
- 2041 Utility Rd
- 1930 Utility Rd
- 1933 Utility Rd
- 2055 Utility Rd
- 243 Miracle Dr
- 2014 Westin Way
- 2133 Miracle Dr
- 319 Miracle Dr
- 1931 Utility Rd
- 1927 Utility Rd
- 2005 Westin Way
- 1921 Utility Rd
- 716 Farmbrook Dr
- 2010 Westin Way
Your Personal Tour Guide
Ask me questions while you tour the home.