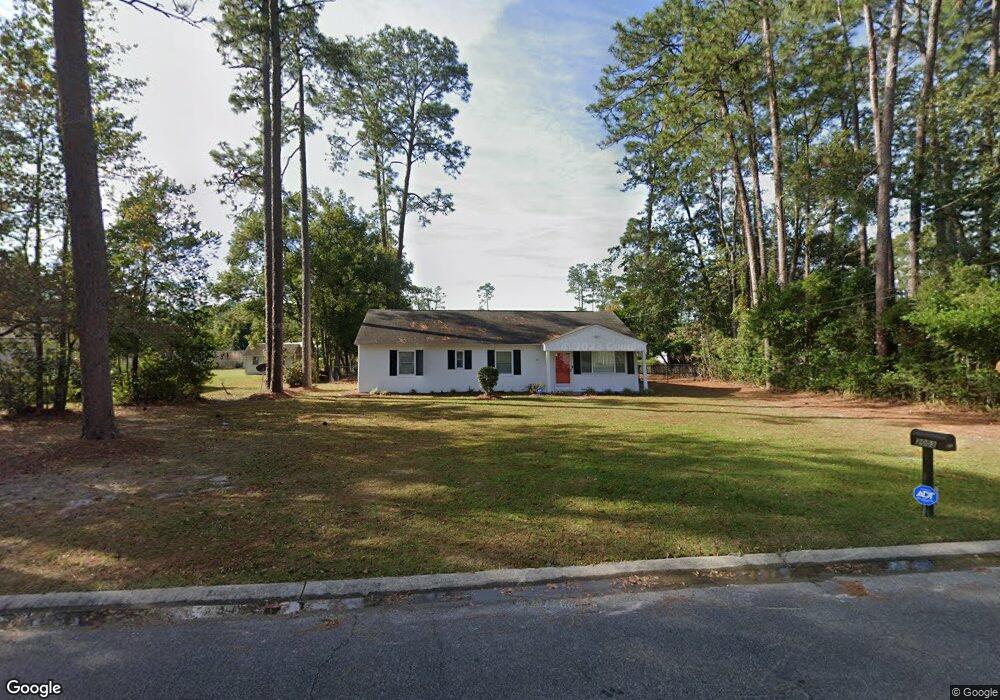
2003 Woodrow Ave Waycross, GA 31503
Estimated Value: $159,000 - $185,000
3
Beds
2
Baths
1,410
Sq Ft
$120/Sq Ft
Est. Value
About This Home
This home is located at 2003 Woodrow Ave, Waycross, GA 31503 and is currently estimated at $169,089, approximately $119 per square foot. 2003 Woodrow Ave is a home located in Ware County with nearby schools including Waresboro Elementary School, Ware County Middle School, and Ware County High School.
Ownership History
Date
Name
Owned For
Owner Type
Purchase Details
Closed on
Sep 28, 2023
Sold by
White Rodney G
Bought by
Simmons Patrick and Simmons Sarah
Current Estimated Value
Home Financials for this Owner
Home Financials are based on the most recent Mortgage that was taken out on this home.
Original Mortgage
$8,150
Outstanding Balance
$7,004
Interest Rate
7.18%
Mortgage Type
New Conventional
Estimated Equity
$162,085
Purchase Details
Closed on
Oct 24, 2014
Sold by
Tucker Edna M
Bought by
White Rodney G and White Victoria E
Home Financials for this Owner
Home Financials are based on the most recent Mortgage that was taken out on this home.
Original Mortgage
$40,000
Interest Rate
4.26%
Mortgage Type
New Conventional
Purchase Details
Closed on
May 21, 2008
Sold by
Tucker John R
Bought by
Tucker Edna M
Create a Home Valuation Report for This Property
The Home Valuation Report is an in-depth analysis detailing your home's value as well as a comparison with similar homes in the area
Home Values in the Area
Average Home Value in this Area
Purchase History
| Date | Buyer | Sale Price | Title Company |
|---|---|---|---|
| Simmons Patrick | $163,000 | -- | |
| White Rodney G | $50,000 | -- | |
| Tucker Edna M | -- | -- |
Source: Public Records
Mortgage History
| Date | Status | Borrower | Loan Amount |
|---|---|---|---|
| Open | Simmons Patrick | $8,150 | |
| Open | Simmons Patrick | $160,047 | |
| Previous Owner | White Rodney G | $40,000 |
Source: Public Records
Tax History Compared to Growth
Tax History
| Year | Tax Paid | Tax Assessment Tax Assessment Total Assessment is a certain percentage of the fair market value that is determined by local assessors to be the total taxable value of land and additions on the property. | Land | Improvement |
|---|---|---|---|---|
| 2024 | $1,290 | $51,106 | $3,780 | $47,326 |
| 2023 | $1,315 | $32,548 | $3,108 | $29,440 |
| 2022 | $940 | $32,548 | $3,108 | $29,440 |
| 2021 | $758 | $24,162 | $3,108 | $21,054 |
| 2020 | $739 | $23,292 | $3,108 | $20,184 |
| 2019 | $725 | $22,422 | $3,108 | $19,314 |
| 2018 | $703 | $21,552 | $3,108 | $18,444 |
| 2017 | $703 | $21,552 | $3,108 | $18,444 |
| 2016 | $703 | $21,552 | $3,108 | $18,444 |
| 2015 | $658 | $21,552 | $3,108 | $18,444 |
| 2014 | $26 | $21,552 | $3,108 | $18,444 |
| 2013 | -- | $21,552 | $3,108 | $18,444 |
Source: Public Records
Map
Nearby Homes
- 2001 Woodrow Ave
- 1008 N Augusta Ave
- 1006 N Augusta Ave
- 1001 Winona Ave
- 1002 N Augusta Ave
- 1912 Woodrow Ave
- 1012 N Augusta Ave
- 1918 Lamar Ave
- 1918 Lamar Ave Unit 1918 Lamar Ave
- 1912 Lamar Ave
- 1100 Winona Ave
- 1103 Winona Ave
- 0 Winona Ave
- 1910 Woodrow Ave
- 1009 N Augusta Ave
- 00 Woodrow Ave Lot
- 00 Woodrow Ave
- 1910 Lamar Ave
- 1005 N Augusta Ave
- 1917 Lamar Ave