Estimated Value: $629,000 - $669,000
5
Beds
3
Baths
2,733
Sq Ft
$237/Sq Ft
Est. Value
About This Home
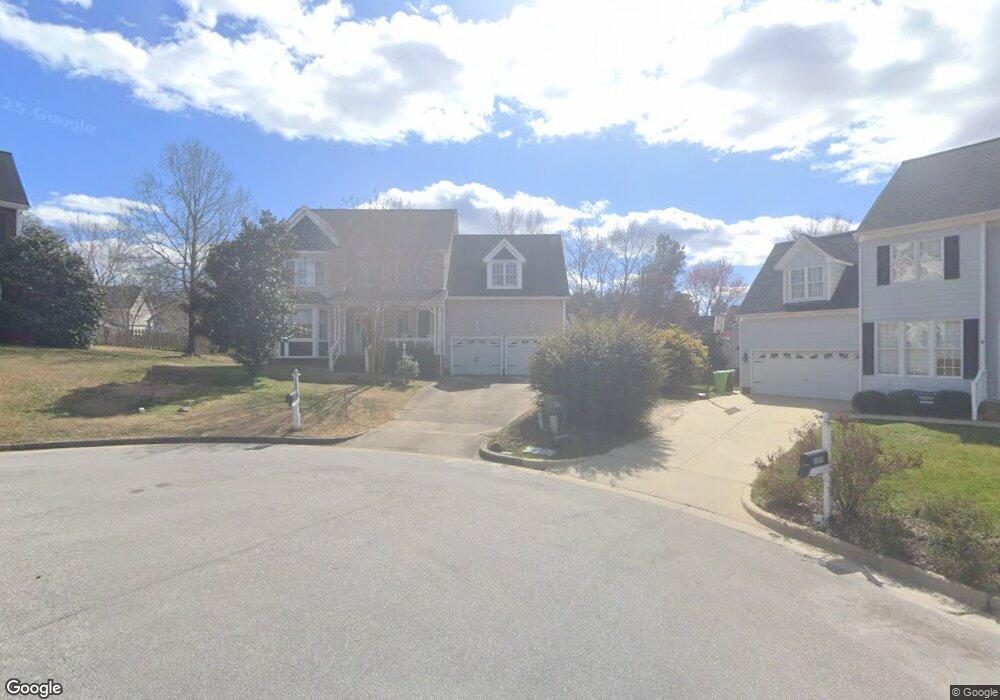
This home is located at 2004 Brandenton Way, Apex, NC 27502 and is currently estimated at $648,832, approximately $237 per square foot. 2004 Brandenton Way is a home located in Wake County with nearby schools including Olive Chapel Elementary School, Lufkin Road Middle School, and Apex Friendship High School.
Ownership History
Date
Name
Owned For
Owner Type
Purchase Details
Closed on
Oct 30, 2014
Sold by
Wassmer Thomas E and Wassmer Susan A
Bought by
Bryan James W and Bryan Kari E
Current Estimated Value
Home Financials for this Owner
Home Financials are based on the most recent Mortgage that was taken out on this home.
Original Mortgage
$269,670
Outstanding Balance
$208,763
Interest Rate
4.29%
Mortgage Type
New Conventional
Estimated Equity
$440,069
Purchase Details
Closed on
Apr 21, 1998
Sold by
Snyder Hunt Of North Carolina Inc
Bought by
Wassmer Thomas E and Wassmer Susan A
Home Financials for this Owner
Home Financials are based on the most recent Mortgage that was taken out on this home.
Original Mortgage
$128,728
Interest Rate
6.75%
Mortgage Type
Construction
Create a Home Valuation Report for This Property
The Home Valuation Report is an in-depth analysis detailing your home's value as well as a comparison with similar homes in the area
Home Values in the Area
Average Home Value in this Area
Purchase History
| Date | Buyer | Sale Price | Title Company |
|---|---|---|---|
| Bryan James W | $303,000 | None Available | |
| Wassmer Thomas E | $35,000 | -- |
Source: Public Records
Mortgage History
| Date | Status | Borrower | Loan Amount |
|---|---|---|---|
| Open | Bryan James W | $269,670 | |
| Previous Owner | Wassmer Thomas E | $128,728 |
Source: Public Records
Tax History Compared to Growth
Tax History
| Year | Tax Paid | Tax Assessment Tax Assessment Total Assessment is a certain percentage of the fair market value that is determined by local assessors to be the total taxable value of land and additions on the property. | Land | Improvement |
|---|---|---|---|---|
| 2025 | $5,222 | $595,816 | $180,000 | $415,816 |
| 2024 | $5,105 | $595,816 | $180,000 | $415,816 |
| 2023 | $4,255 | $386,020 | $88,000 | $298,020 |
| 2022 | $3,994 | $386,020 | $88,000 | $298,020 |
| 2021 | $3,842 | $386,020 | $88,000 | $298,020 |
| 2020 | $3,803 | $386,020 | $88,000 | $298,020 |
| 2019 | $3,631 | $317,965 | $88,000 | $229,965 |
| 2018 | $3,420 | $317,965 | $88,000 | $229,965 |
| 2017 | $3,184 | $317,965 | $88,000 | $229,965 |
| 2016 | $3,138 | $317,965 | $88,000 | $229,965 |
| 2015 | $3,076 | $304,222 | $72,000 | $232,222 |
| 2014 | $2,965 | $304,222 | $72,000 | $232,222 |
Source: Public Records
Map
Nearby Homes
- 1706 Patterson Grove Rd
- 1004 Wild Sonnet Ct
- 1002 Tribble Gate Ct
- 2117 Barrier Ridge Way Unit Lot 24
- 2119 Barrier Ridge Way Unit Lot 23
- 2115 Barrier Ridge Way Unit Lot 25
- 2113 Barrier Ridge Way Unit Lot 26
- 2120 Barrier Ridge Way Unit Lot 36
- 1127 Palisade Bluff Ln
- 2112 Barrier Ridge Way Unit Lot 34
- 2122 Barrier Ridge Way Unit Lot 37
- 2118 Barrier Ridge Way Unit Lot 35
- 1114 Palisade Bluff Ln Unit Lot 7
- 2124 Barrier Ridge Way
- 3014 Silky Dogwood Trail
- 1110 Palisade Bluff Ln Unit Lot 5
- 1116 Palisade Bluff Ln Unit Lot 8
- 1117 Palisade Bluff Ln Unit Lot 43
- 2008 Silky Dogwood Trail
- 104 Pine Tag Ct
- 2002 Brandenton Way
- 2005 Brandenton Way
- 1609 Patterson Grove Rd
- 1607 Patterson Grove Rd
- 1611 Patterson Grove Rd
- 1615 Patterson Grove Rd
- 2003 Brandenton Way
- 2000 Brandenton Way
- 1617 Patterson Grove Rd
- 1605 Patterson Grove Rd
- 1112 Heathwood Dairy Rd
- 1701 Patterson Grove Rd
- 2001 Brandenton Way
- 1705 Patterson Grove Rd
- 1603 Patterson Grove Rd
- 1709 Patterson Grove Rd
- 1110 Heathwood Dairy Rd
- 1601 Kelvington Place
- 1608 Patterson Grove Rd
- 1601 Patterson Grove Rd