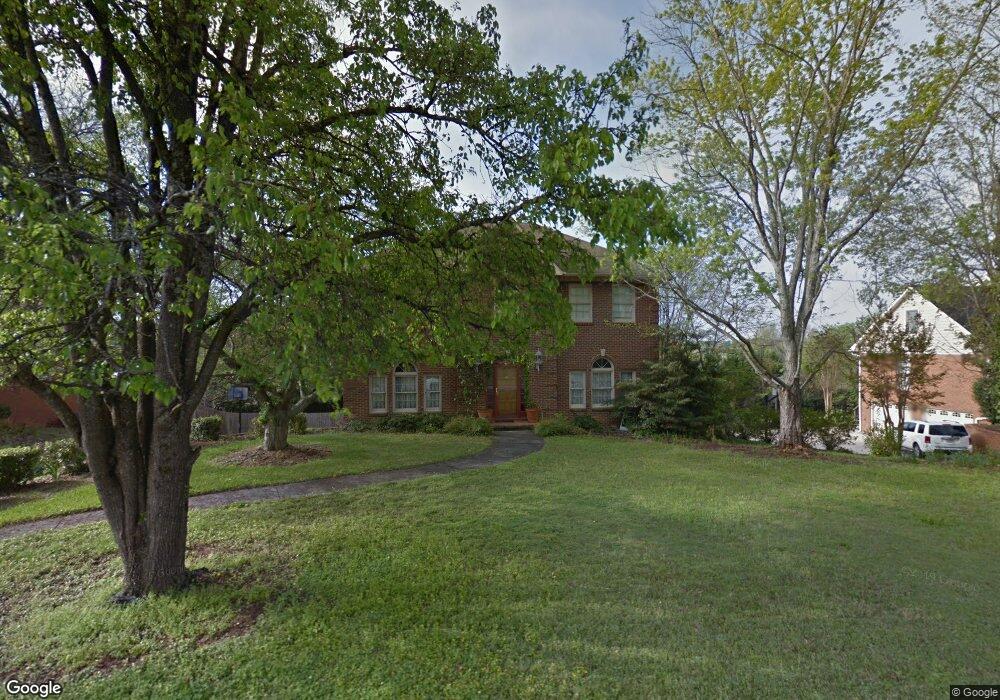
2004 Cahaba Crest Dr Birmingham, AL 35242
Estimated Value: $469,000 - $527,145
--
Bed
3
Baths
2,923
Sq Ft
$169/Sq Ft
Est. Value
About This Home
This home is located at 2004 Cahaba Crest Dr, Birmingham, AL 35242 and is currently estimated at $494,786, approximately $169 per square foot. 2004 Cahaba Crest Dr is a home located in Shelby County with nearby schools including Rocky Ridge Elementary School, Berry Middle School, and Spain Park High School.
Ownership History
Date
Name
Owned For
Owner Type
Purchase Details
Closed on
Sep 13, 2019
Sold by
Haynes Erin Crowe
Bought by
Haynes Erin Crowe and Haynes Brandon Dvonta
Current Estimated Value
Purchase Details
Closed on
Aug 7, 2019
Sold by
Haynes Erin Crowe
Bought by
Crowe Haynes Erin
Purchase Details
Closed on
Mar 30, 2000
Sold by
Coffey Brian P and Coffey Stephanie J
Bought by
Crowe L Kenneth
Home Financials for this Owner
Home Financials are based on the most recent Mortgage that was taken out on this home.
Original Mortgage
$100,000
Outstanding Balance
$34,629
Interest Rate
8.38%
Estimated Equity
$460,157
Purchase Details
Closed on
Nov 30, 1998
Sold by
Houghteling Mark J and Houghteling Tammy M
Bought by
Coffey Brian P and Coffey Stephanie J
Home Financials for this Owner
Home Financials are based on the most recent Mortgage that was taken out on this home.
Original Mortgage
$219,830
Interest Rate
6.9%
Create a Home Valuation Report for This Property
The Home Valuation Report is an in-depth analysis detailing your home's value as well as a comparison with similar homes in the area
Home Values in the Area
Average Home Value in this Area
Purchase History
| Date | Buyer | Sale Price | Title Company |
|---|---|---|---|
| Haynes Erin Crowe | -- | None Available | |
| Crowe Haynes Erin | -- | None Available | |
| Crowe L Kenneth | $240,000 | -- | |
| Coffey Brian P | $231,400 | Magic City Title Company Inc |
Source: Public Records
Mortgage History
| Date | Status | Borrower | Loan Amount |
|---|---|---|---|
| Open | Crowe L Kenneth | $100,000 | |
| Previous Owner | Coffey Brian P | $219,830 |
Source: Public Records
Tax History Compared to Growth
Tax History
| Year | Tax Paid | Tax Assessment Tax Assessment Total Assessment is a certain percentage of the fair market value that is determined by local assessors to be the total taxable value of land and additions on the property. | Land | Improvement |
|---|---|---|---|---|
| 2024 | $2,978 | $44,780 | $0 | $0 |
| 2023 | $2,731 | $41,540 | $0 | $0 |
| 2022 | $2,420 | $37,000 | $0 | $0 |
| 2021 | $2,252 | $34,480 | $0 | $0 |
| 2020 | $2,168 | $33,220 | $0 | $0 |
| 2019 | $0 | $32,000 | $0 | $0 |
| 2017 | $0 | $32,080 | $0 | $0 |
| 2015 | $1,901 | $29,200 | $0 | $0 |
| 2014 | $1,891 | $29,060 | $0 | $0 |
Source: Public Records
Map
Nearby Homes
- 2064 Cahaba Crest Dr
- 4505 Buttewoods Ln
- 2272 Vanessa Dr
- 728 Heatherwood Dr
- 3251 Crossings Dr
- 2933 Riverwood Terrace
- 2448 International Park Place
- 4181 Crossings Ln
- 704 Saint Andrews Ln
- 2520 International Park Dr Unit 1
- 2955 Altadena Ridge Dr
- 4751 Caldwell Mill Rd
- 2007 Wilmington Place
- 2708 Corsair Dr
- 2707 Acton Rd
- 2324 Longleaf Way
- 2723 Acton Rd
- 4231 Camp Horner Rd
- 2737 Acton Rd
- 4912 Mountain View Pkwy
- 2008 Cahaba Crest Dr
- 2000 Cahaba Crest Dr
- 2448 Lancaster Cir
- 2005 Cahaba Crest Dr
- 2001 Cahaba Crest Dr
- 2452 Lancaster Cir
- 2012 Cahaba Crest Dr
- 1996 Cahaba Crest Dr
- 2009 Cahaba Crest Dr
- 2444 Lancaster Cir
- 2013 Cahaba Crest Dr
- 2829 Lakewood Trace
- 2205 Vanessa Dr
- 2833 Lakewood Trace
- 2201 Vanessa Dr
- 1997 Cahaba Crest Dr
- 2451 Lancaster Cir
- 2440 Lancaster Cir
- 2825 Lakewood Trace
- 2017 Cahaba Crest Dr