Estimated Value: $342,466 - $367,000
3
Beds
2
Baths
1,656
Sq Ft
$213/Sq Ft
Est. Value
About This Home
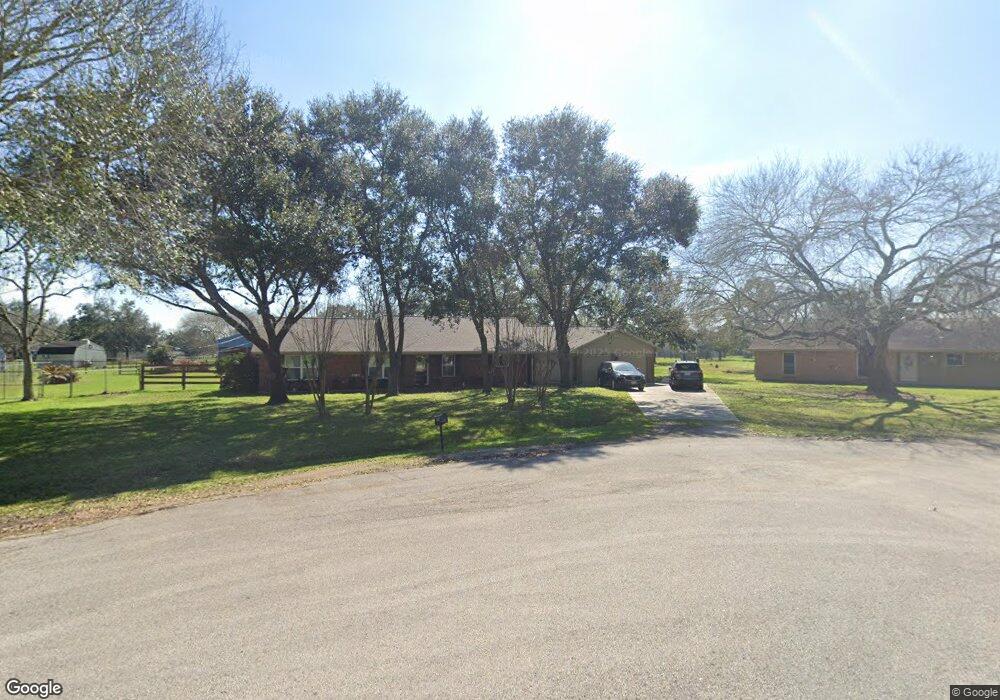
This home is located at 2004 County Road 966, Alvin, TX 77511 and is currently estimated at $352,117, approximately $212 per square foot. 2004 County Road 966 is a home located in Brazoria County with nearby schools including Hood-Case Elementary School, G.W. Harby Junior High School, and Alvin High School.
Ownership History
Date
Name
Owned For
Owner Type
Purchase Details
Closed on
Sep 23, 2015
Sold by
Mosis Joshua and Mosis Dawn
Bought by
Deholt Jack H
Current Estimated Value
Purchase Details
Closed on
Feb 27, 2008
Sold by
Mosis Miranda Denise
Bought by
Mosis Joshua Aaron
Purchase Details
Closed on
Nov 22, 2006
Sold by
Naivar Kevin S and Naivar Karen E
Bought by
Miranda Mosis Joshua and Miranda Mosis
Home Financials for this Owner
Home Financials are based on the most recent Mortgage that was taken out on this home.
Original Mortgage
$126,800
Interest Rate
7.4%
Mortgage Type
Purchase Money Mortgage
Purchase Details
Closed on
Jan 6, 1999
Sold by
Fisher Rex Alan and Fisher Deaion A
Bought by
Naivar Kevin S and Naivar Karen E
Home Financials for this Owner
Home Financials are based on the most recent Mortgage that was taken out on this home.
Original Mortgage
$78,800
Interest Rate
6.74%
Create a Home Valuation Report for This Property
The Home Valuation Report is an in-depth analysis detailing your home's value as well as a comparison with similar homes in the area
Home Values in the Area
Average Home Value in this Area
Purchase History
| Date | Buyer | Sale Price | Title Company |
|---|---|---|---|
| Deholt Jack H | -- | None Available | |
| Mosis Joshua Aaron | -- | None Available | |
| Miranda Mosis Joshua | -- | Alamo Title 4 | |
| Naivar Kevin S | -- | -- |
Source: Public Records
Mortgage History
| Date | Status | Borrower | Loan Amount |
|---|---|---|---|
| Previous Owner | Miranda Mosis Joshua | $126,800 | |
| Previous Owner | Naivar Kevin S | $78,800 | |
| Closed | Naivar Kevin S | $9,850 |
Source: Public Records
Tax History Compared to Growth
Tax History
| Year | Tax Paid | Tax Assessment Tax Assessment Total Assessment is a certain percentage of the fair market value that is determined by local assessors to be the total taxable value of land and additions on the property. | Land | Improvement |
|---|---|---|---|---|
| 2025 | $1,091 | $301,077 | $127,760 | $244,480 |
| 2023 | $1,091 | $248,824 | $127,760 | $230,190 |
| 2022 | $1,863 | $226,204 | $135,410 | $181,080 |
| 2021 | $4,563 | $225,520 | $31,050 | $194,470 |
| 2020 | $4,204 | $190,540 | $20,700 | $169,840 |
| 2019 | $3,934 | $169,950 | $20,700 | $149,250 |
| 2018 | $3,776 | $162,680 | $20,700 | $141,980 |
| 2017 | $3,513 | $149,530 | $20,700 | $128,830 |
| 2016 | $4,011 | $170,730 | $26,910 | $143,820 |
| 2015 | $3,170 | $166,550 | $20,700 | $145,850 |
| 2014 | $3,170 | $161,830 | $20,700 | $141,130 |
Source: Public Records
Map
Nearby Homes
- 1690 County Road 965
- 1695 County Road 965
- 1871 County Road 936
- 2257 County Road 529
- 1236 County Road 634
- 1688 County Road 144
- 3046 County Road 529
- 1816 County Road 936b
- 1513 County Road 149
- 1259 County Road 147
- 0 Cardinal Dr
- 1290 County Road 145
- 2052 County Road 540
- 1950 County Road 540
- 0 County Road 540
- 1153 County Road 150
- 2518 W Highway 6
- 3245 W Highway 6
- 925 County Road 737b
- 4738 Alluvial Cir
- 2002 County Road 966
- 2034 County Road 966
- 2001 County Road 966
- 2005 County Road 966
- 2078 County Road 966
- 2599 County Road 529
- 1767 County Road 965
- 2557 County Road 529
- 2061 County Road 966
- 1749 County Road 965
- 1789 County Road 965
- 00 County Road 965
- 2087 County Road 966
- 1737 County Road 965
- 2630 County Road 529
- 2540 County Road 529
- 2652 County Road 529
- 2652 Cr 529
- 2000 County Road 529a
- 965 County Road 965