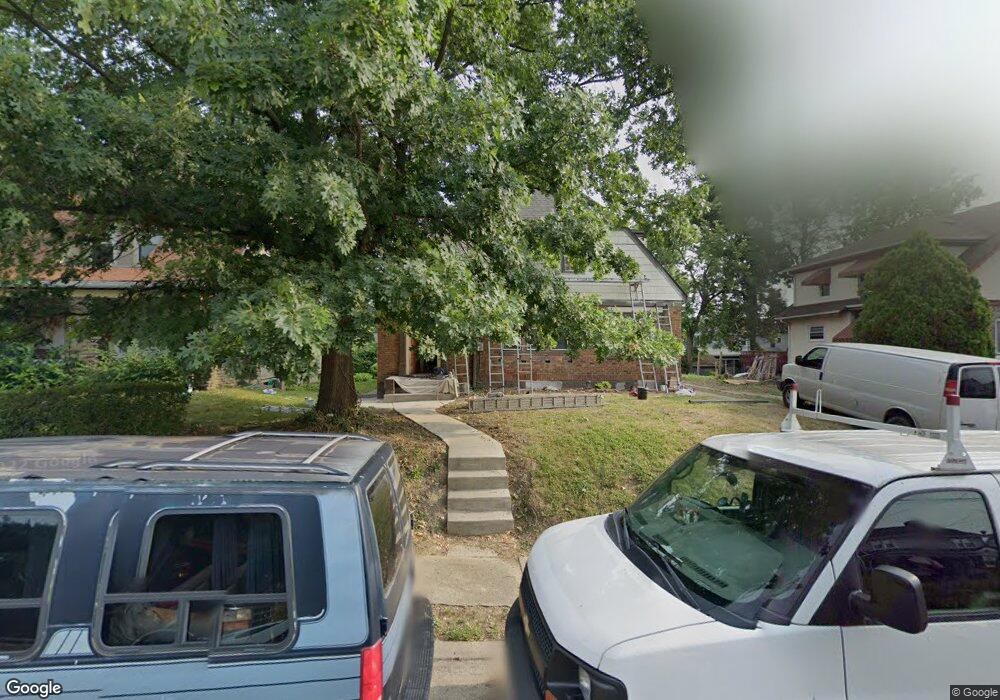
2004 Crane Ave Cincinnati, OH 45207
Evanston NeighborhoodEstimated Value: $311,000 - $335,000
3
Beds
1
Bath
1,810
Sq Ft
$179/Sq Ft
Est. Value
About This Home
This home is located at 2004 Crane Ave, Cincinnati, OH 45207 and is currently estimated at $324,869, approximately $179 per square foot. 2004 Crane Ave is a home located in Hamilton County with nearby schools including Evanston Academy Elementary School, Clark Montessori High School, and Shroder High School.
Ownership History
Date
Name
Owned For
Owner Type
Purchase Details
Closed on
Jan 6, 2023
Sold by
Pdp1 Llc
Bought by
Rader Nicolette Katherine and Rader Adam Thomas
Current Estimated Value
Home Financials for this Owner
Home Financials are based on the most recent Mortgage that was taken out on this home.
Original Mortgage
$261,000
Outstanding Balance
$251,632
Interest Rate
6.49%
Mortgage Type
New Conventional
Estimated Equity
$73,237
Purchase Details
Closed on
Dec 6, 2021
Sold by
Zimmer Hans M
Bought by
Pdp 1 Llc
Purchase Details
Closed on
Feb 17, 2005
Sold by
Glover Beatrice
Bought by
Glover Kenya S
Purchase Details
Closed on
Jul 11, 2003
Sold by
Hill Bobby
Bought by
Glover Beatrice
Home Financials for this Owner
Home Financials are based on the most recent Mortgage that was taken out on this home.
Original Mortgage
$88,000
Interest Rate
8.87%
Mortgage Type
Unknown
Purchase Details
Closed on
Jan 3, 2001
Sold by
Estate Of Rosetta Hill
Bought by
Hill Nathan
Create a Home Valuation Report for This Property
The Home Valuation Report is an in-depth analysis detailing your home's value as well as a comparison with similar homes in the area
Home Values in the Area
Average Home Value in this Area
Purchase History
| Date | Buyer | Sale Price | Title Company |
|---|---|---|---|
| Rader Nicolette Katherine | $279,000 | Prodigy Title | |
| Rader Nicolette Katherine | $279,000 | Prodigy Title | |
| Pdp 1 Llc | $120,500 | Matre James A | |
| Pdp 1 Llc | $120,500 | Matre James A | |
| Glover Kenya S | $67,000 | None Available | |
| Glover Beatrice | $88,000 | -- | |
| Hill Nathan | -- | -- |
Source: Public Records
Mortgage History
| Date | Status | Borrower | Loan Amount |
|---|---|---|---|
| Open | Rader Nicolette Katherine | $261,000 | |
| Closed | Rader Nicolette Katherine | $261,000 | |
| Previous Owner | Glover Beatrice | $88,000 |
Source: Public Records
Tax History
| Year | Tax Paid | Tax Assessment Tax Assessment Total Assessment is a certain percentage of the fair market value that is determined by local assessors to be the total taxable value of land and additions on the property. | Land | Improvement |
|---|---|---|---|---|
| 2025 | $2,731 | $97,651 | $8,334 | $89,317 |
| 2024 | $2,648 | $97,651 | $8,334 | $89,317 |
| 2023 | $2,708 | $97,651 | $8,334 | $89,317 |
| 2022 | $1,303 | $18,253 | $6,045 | $12,208 |
| 2021 | $1,276 | $18,253 | $6,045 | $12,208 |
| 2020 | $1,280 | $18,253 | $6,045 | $12,208 |
| 2019 | $1,289 | $16,744 | $5,544 | $11,200 |
| 2018 | $1,290 | $16,744 | $5,544 | $11,200 |
| 2017 | $1,242 | $16,744 | $5,544 | $11,200 |
| 2016 | $1,325 | $17,430 | $5,992 | $11,438 |
| 2015 | $1,185 | $17,430 | $5,992 | $11,438 |
| 2014 | $1,191 | $17,430 | $5,992 | $11,438 |
| 2013 | $1,235 | $17,788 | $6,115 | $11,673 |
Source: Public Records
Map
Nearby Homes
- 3460 Bevis Ave
- 3514 Bevis Ave
- 3507 Bevis Ave
- 3533 Evanston Ave
- 3520 Trimble Ave
- 2217 Crane Ave
- 3572 Bevis Ave
- 2014 Clarion Ave
- 2002 Clarion Ave
- 3330 Evanston Ave
- 3419 Trimble Ave
- 3629 Evanston Ave
- 3314 Wabash Ave
- 3628 Bevis Ave
- 3346 Bonaparte Ave
- 2242 Ivy Ave
- 1933 Hewitt Ave
- 3336 Graydon Ave
- 1930 Kinney Ave
- 1989 Kinney Ave
- 3456 Wabash Ave
- 2006 Crane Ave
- 3460 Wabash Ave
- 3461 Evanston Ave
- 2008 Crane Ave
- 3465 Evanston Ave
- 3464 Wabash Ave
- 2003 Crane Ave
- 1942 Crane Ave
- 3467 Evanston Ave
- 2007 Crane Ave
- 2001 Crane Ave
- 3469 Evanston Ave
- 3466 Wabash Ave
- 2009 Crane Ave
- 08 Evanston Ave
- 3461 Wabash Ave
- 1932 Crane Ave
- 3473 Evanston Ave
- 3463 Wabash Ave
Your Personal Tour Guide
Ask me questions while you tour the home.