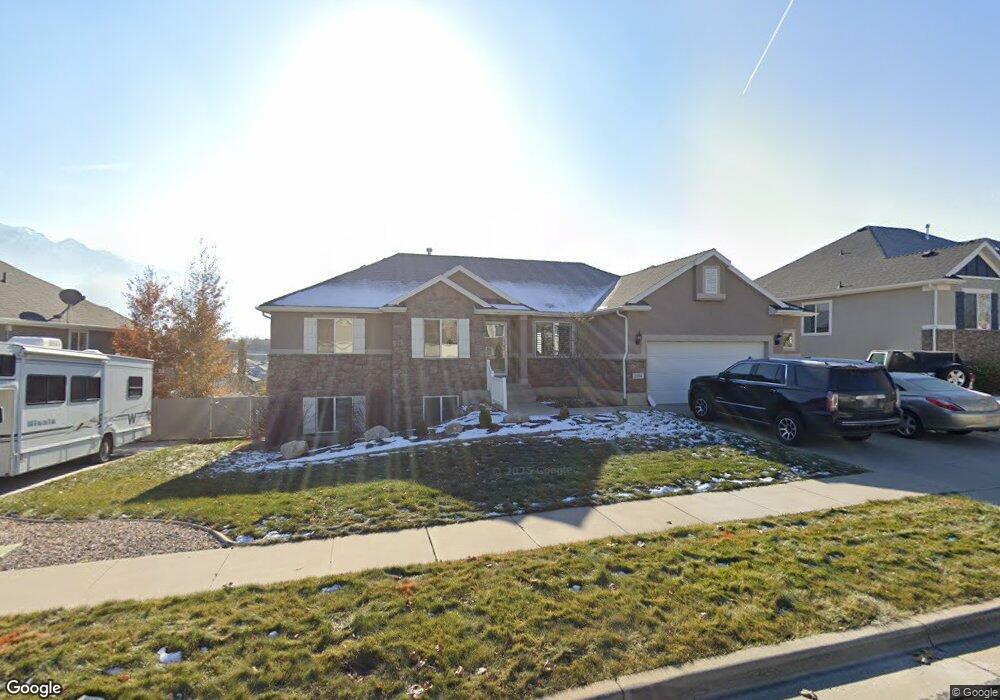
2004 E Redshoulder Dr Layton, UT 84040
Estimated Value: $583,000 - $674,000
5
Beds
3
Baths
3,142
Sq Ft
$198/Sq Ft
Est. Value
About This Home
This home is located at 2004 E Redshoulder Dr, Layton, UT 84040 and is currently estimated at $622,131, approximately $198 per square foot. 2004 E Redshoulder Dr is a home located in Davis County with nearby schools including Mountain View Elementary School, North Layton Junior High School, and Northridge High School.
Ownership History
Date
Name
Owned For
Owner Type
Purchase Details
Closed on
Dec 5, 2017
Sold by
Tarbet Lisa and Tarbet Shane
Bought by
Berrones Gwendoline A and Berrones Frank L
Current Estimated Value
Home Financials for this Owner
Home Financials are based on the most recent Mortgage that was taken out on this home.
Original Mortgage
$354,358
Outstanding Balance
$297,327
Interest Rate
3.9%
Mortgage Type
VA
Estimated Equity
$324,804
Purchase Details
Closed on
May 24, 2012
Sold by
Ivory Homes Ltd
Bought by
Tarbet Lisa and Tarbet Shane
Home Financials for this Owner
Home Financials are based on the most recent Mortgage that was taken out on this home.
Original Mortgage
$285,572
Interest Rate
4.4%
Mortgage Type
FHA
Purchase Details
Closed on
Jan 19, 2010
Sold by
Western States Ventures Llc
Bought by
Ivory Homes Ltd
Purchase Details
Closed on
Jan 7, 2010
Sold by
Centennial Bank Inc
Bought by
Western States Ventures Llc
Create a Home Valuation Report for This Property
The Home Valuation Report is an in-depth analysis detailing your home's value as well as a comparison with similar homes in the area
Home Values in the Area
Average Home Value in this Area
Purchase History
| Date | Buyer | Sale Price | Title Company |
|---|---|---|---|
| Berrones Gwendoline A | -- | First American Title | |
| Tarbet Lisa | -- | Cottonwood Title Ins Agency | |
| Ivory Homes Ltd | -- | Cottonwood Title Ins Agency | |
| Western States Ventures Llc | -- | None Available | |
| Centennial Bank Inc | $5,580,000 | None Available |
Source: Public Records
Mortgage History
| Date | Status | Borrower | Loan Amount |
|---|---|---|---|
| Open | Berrones Gwendoline A | $354,358 | |
| Previous Owner | Tarbet Lisa | $285,572 |
Source: Public Records
Tax History
| Year | Tax Paid | Tax Assessment Tax Assessment Total Assessment is a certain percentage of the fair market value that is determined by local assessors to be the total taxable value of land and additions on the property. | Land | Improvement |
|---|---|---|---|---|
| 2025 | $3,445 | $338,800 | $112,537 | $226,263 |
| 2024 | $3,254 | $323,950 | $138,289 | $185,661 |
| 2023 | $3,329 | $590,000 | $134,987 | $455,013 |
| 2022 | $3,435 | $332,200 | $71,289 | $260,911 |
| 2021 | $3,085 | $444,000 | $118,413 | $325,587 |
| 2020 | $2,917 | $403,000 | $91,888 | $311,112 |
| 2019 | $2,846 | $387,000 | $95,778 | $291,222 |
| 2018 | $2,642 | $361,000 | $94,186 | $266,814 |
| 2016 | $2,496 | $178,200 | $41,892 | $136,308 |
| 2015 | $2,417 | $164,395 | $41,892 | $122,503 |
| 2014 | $2,279 | $159,028 | $38,084 | $120,944 |
| 2013 | -- | $162,578 | $38,010 | $124,568 |
Source: Public Records
Map
Nearby Homes
- 3232 N Redtail Way
- 1827 E Whitetail Dr
- 1821 E Whitetail Way
- 1935 Deere Valley Dr
- 1911 Deere Valley Dr
- 1785 E 2825 N
- 1731 E 2825 N
- 2353 Canyon View Dr
- 2826 N 1600 E
- 3176 N 1450 E
- 1321 E 3125 N
- 2597 N 2300 E
- 1447 E 2700 N
- 1266 E 3125 N
- 1241 E 3075 N
- 3142 E Thorley Dr
- 3138 E Thorley Dr
- 2340 N 2050 E
- 2273 N 1975 E
- 935 E 3000 N Unit 183
- 1990 E Redshoulder Dr
- 2018 E Redshoulder Dr
- 2021 E Redtail Way
- 2005 E Redtail Way
- 3221 N Broadwing Dr
- 1993 E Redshoulder Dr
- 1976 E Redshoulder Dr
- 2007 E Redshoulder Dr
- 1977 E Redshoulder Dr
- 1991 E Redtail Way
- 3259 N Redshoulder Dr
- 3256 N Redshoulder Dr
- 1962 E Redshoulder Dr
- 2028 E Redtail Way
- 2016 E Redtail Way
- 1972 E Osprey Way
- 1972 E Osprey Way Unit 55
- 3228 N Broadwing Dr
- 1964 E Osprey Way
- 1964 E Osprey Way
Your Personal Tour Guide
Ask me questions while you tour the home.