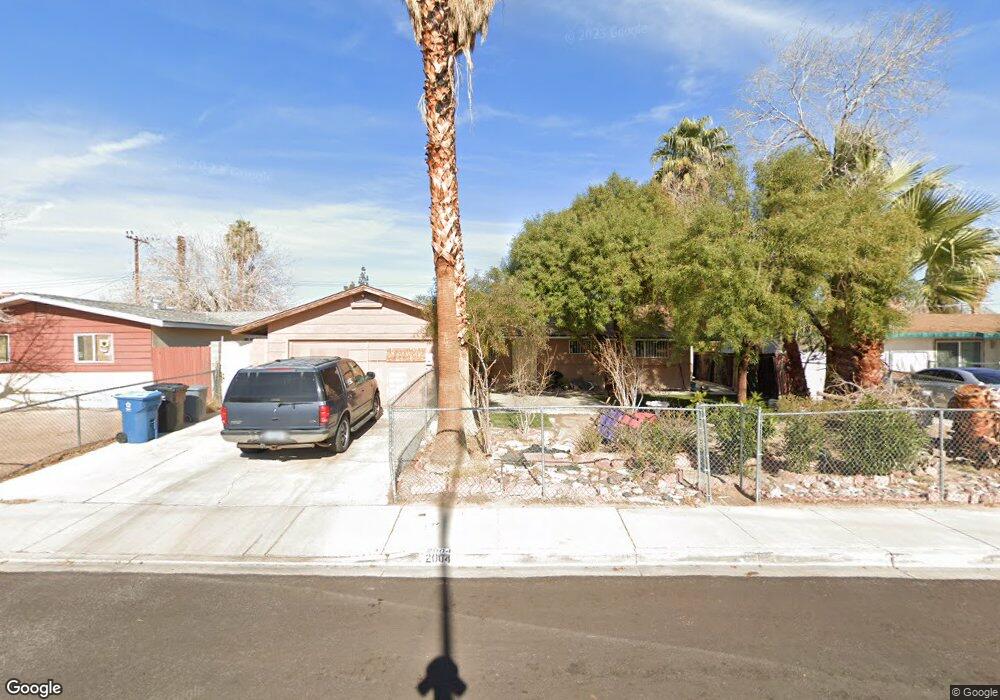
2004 Embrey Ave Unit 1 Las Vegas, NV 89106
Rancho Oakey NeighborhoodEstimated Value: $363,555 - $406,000
3
Beds
2
Baths
1,728
Sq Ft
$223/Sq Ft
Est. Value
About This Home
This home is located at 2004 Embrey Ave Unit 1, Las Vegas, NV 89106 and is currently estimated at $384,889, approximately $222 per square foot. 2004 Embrey Ave Unit 1 is a home located in Clark County with nearby schools including Howard Wasden Elementary School, Hyde Park Middle School, and Ed W Clark High School.
Ownership History
Date
Name
Owned For
Owner Type
Purchase Details
Closed on
Nov 30, 2010
Sold by
Ventura Johnny W and Ventura Teresa
Bought by
Diaz Jesus Gerardo and Diaz Dora Ninfa
Current Estimated Value
Purchase Details
Closed on
May 31, 2006
Sold by
Ventura Johnny W and Ventura Teresa
Bought by
Ventura Johnny W and Ventura Teresa
Purchase Details
Closed on
Sep 17, 2001
Sold by
Fleming K E
Bought by
Ventura Jony W and Ventura Teresa
Home Financials for this Owner
Home Financials are based on the most recent Mortgage that was taken out on this home.
Original Mortgage
$112,990
Interest Rate
6.99%
Mortgage Type
FHA
Create a Home Valuation Report for This Property
The Home Valuation Report is an in-depth analysis detailing your home's value as well as a comparison with similar homes in the area
Home Values in the Area
Average Home Value in this Area
Purchase History
| Date | Buyer | Sale Price | Title Company |
|---|---|---|---|
| Diaz Jesus Gerardo | $58,000 | Old Republic Title Company | |
| Ventura Johnny W | -- | Accommodation | |
| Ventura Jony W | $114,000 | National Title Company |
Source: Public Records
Mortgage History
| Date | Status | Borrower | Loan Amount |
|---|---|---|---|
| Previous Owner | Ventura Jony W | $112,990 |
Source: Public Records
Tax History Compared to Growth
Tax History
| Year | Tax Paid | Tax Assessment Tax Assessment Total Assessment is a certain percentage of the fair market value that is determined by local assessors to be the total taxable value of land and additions on the property. | Land | Improvement |
|---|---|---|---|---|
| 2025 | $1,162 | $62,064 | $39,200 | $22,864 |
| 2024 | $1,077 | $62,064 | $39,200 | $22,864 |
| 2023 | $1,077 | $53,240 | $32,550 | $20,690 |
| 2022 | $997 | $45,747 | $27,300 | $18,447 |
| 2021 | $924 | $43,066 | $25,900 | $17,166 |
| 2020 | $855 | $39,435 | $22,750 | $16,685 |
| 2019 | $801 | $35,321 | $19,250 | $16,071 |
| 2018 | $764 | $32,585 | $17,500 | $15,085 |
| 2017 | $1,029 | $31,400 | $16,450 | $14,950 |
| 2016 | $717 | $28,043 | $13,650 | $14,393 |
| 2015 | $714 | $24,458 | $10,500 | $13,958 |
| 2014 | $692 | $20,476 | $6,650 | $13,826 |
Source: Public Records
Map
Nearby Homes
- 1921 Granite Ave
- 1908 W Mesquite Ave
- 27 Onyx Way
- 35 Jade Cir
- 248 Crystal Rose Ct
- 226 Dalmatian Ln
- 312 Park Way W
- 324 Park Way E
- 321 Beaumont St
- 360 Vandalia St
- 2401 Driftwood Dr
- 814 W Bonanza Rd
- 1450 Rancho Cir
- 2505 Rancho Bel Air Dr
- 2500 Wimbledon Dr
- 330 Rancho Cir
- 111 Narcissus Ln
- 2211 Sleepy Ct
- 2133 Sleepy Ct
- 2323 Pinto Ln
- 2008 Embrey Ave
- 2000 Embrey Ave
- 2005 Denby Ave
- 2009 Denby Ave
- 2001 Denby Ave
- 2012 Embrey Ave
- 2005 Embrey Ave
- 2013 Denby Ave Unit 1
- 2009 Embrey Ave
- 2001 Embrey Ave
- 1920 Embrey Ave
- 2013 Embrey Ave
- 2017 Denby Ave
- 1921 Denby Ave
- 2017 Embrey Ave
- 1921 Embrey Ave
- 2004 Denby Ave
- 2004 Fontana Ave
- 2020 Embrey Ave
- 2008 Denby Ave