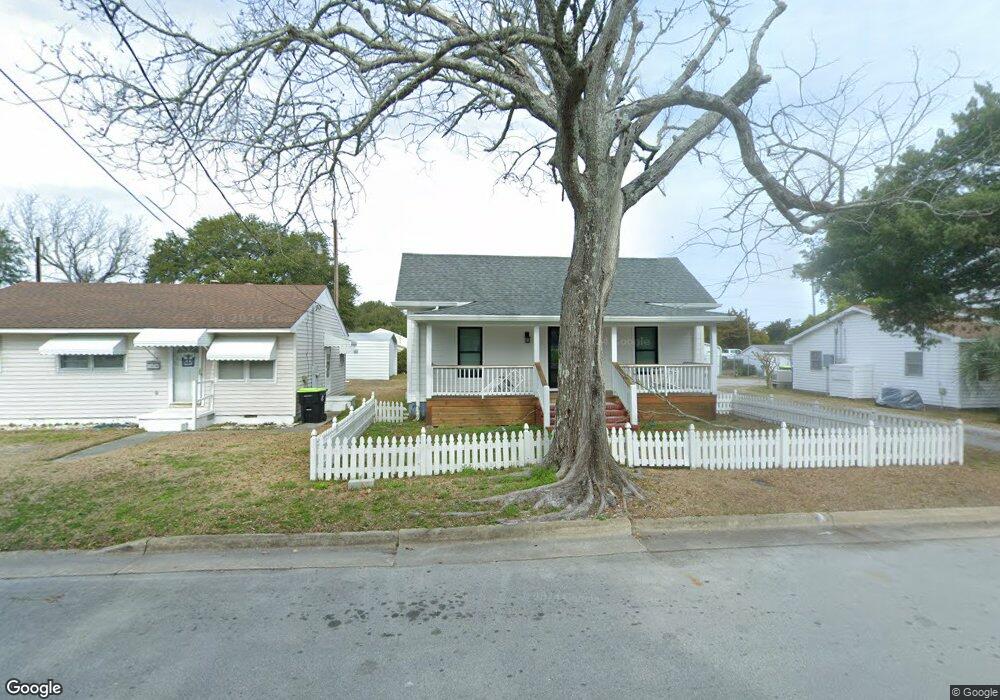
2004 Fisher St Morehead City, NC 28557
Estimated Value: $229,000 - $317,000
2
Beds
1
Bath
1,136
Sq Ft
$249/Sq Ft
Est. Value
About This Home
This home is located at 2004 Fisher St, Morehead City, NC 28557 and is currently estimated at $282,494, approximately $248 per square foot. 2004 Fisher St is a home located in Carteret County with nearby schools including Morehead City Primary School, Morehead Elementary School at Camp Glenn, and Morehead City Middle School.
Ownership History
Date
Name
Owned For
Owner Type
Purchase Details
Closed on
May 8, 2018
Sold by
Johnson Kimberly M
Bought by
Garris Raymond A
Current Estimated Value
Home Financials for this Owner
Home Financials are based on the most recent Mortgage that was taken out on this home.
Original Mortgage
$85,000
Outstanding Balance
$73,272
Interest Rate
4.45%
Mortgage Type
New Conventional
Estimated Equity
$209,222
Purchase Details
Closed on
Jan 25, 2012
Sold by
Brucia Dominic C
Bought by
Johnson Kimberly M
Purchase Details
Closed on
Jul 1, 2006
Sold by
Vander Meulen Robert and Van Der Meulen Ineke
Bought by
Johnson Kimerly M and Brucia Dominic C
Home Financials for this Owner
Home Financials are based on the most recent Mortgage that was taken out on this home.
Original Mortgage
$123,200
Interest Rate
6.6%
Mortgage Type
Purchase Money Mortgage
Create a Home Valuation Report for This Property
The Home Valuation Report is an in-depth analysis detailing your home's value as well as a comparison with similar homes in the area
Home Values in the Area
Average Home Value in this Area
Purchase History
| Date | Buyer | Sale Price | Title Company |
|---|---|---|---|
| Garris Raymond A | $125,000 | None Available | |
| Johnson Kimberly M | -- | None Available | |
| Johnson Kimerly M | $155,000 | None Available |
Source: Public Records
Mortgage History
| Date | Status | Borrower | Loan Amount |
|---|---|---|---|
| Open | Garris Raymond A | $85,000 | |
| Previous Owner | Johnson Kimerly M | $123,200 |
Source: Public Records
Tax History Compared to Growth
Tax History
| Year | Tax Paid | Tax Assessment Tax Assessment Total Assessment is a certain percentage of the fair market value that is determined by local assessors to be the total taxable value of land and additions on the property. | Land | Improvement |
|---|---|---|---|---|
| 2025 | $1,866 | $311,547 | $78,500 | $233,047 |
| 2024 | $955 | $114,200 | $50,625 | $63,575 |
| 2023 | $403 | $114,200 | $50,625 | $63,575 |
| 2022 | $392 | $114,200 | $50,625 | $63,575 |
| 2021 | $392 | $114,200 | $50,625 | $63,575 |
| 2020 | $392 | $114,200 | $50,625 | $63,575 |
| 2019 | $344 | $106,041 | $34,875 | $71,166 |
| 2017 | $344 | $106,041 | $34,875 | $71,166 |
| 2016 | $344 | $106,041 | $34,875 | $71,166 |
| 2015 | $333 | $106,041 | $34,875 | $71,166 |
| 2014 | $407 | $130,562 | $64,140 | $66,422 |
Source: Public Records
Map
Nearby Homes