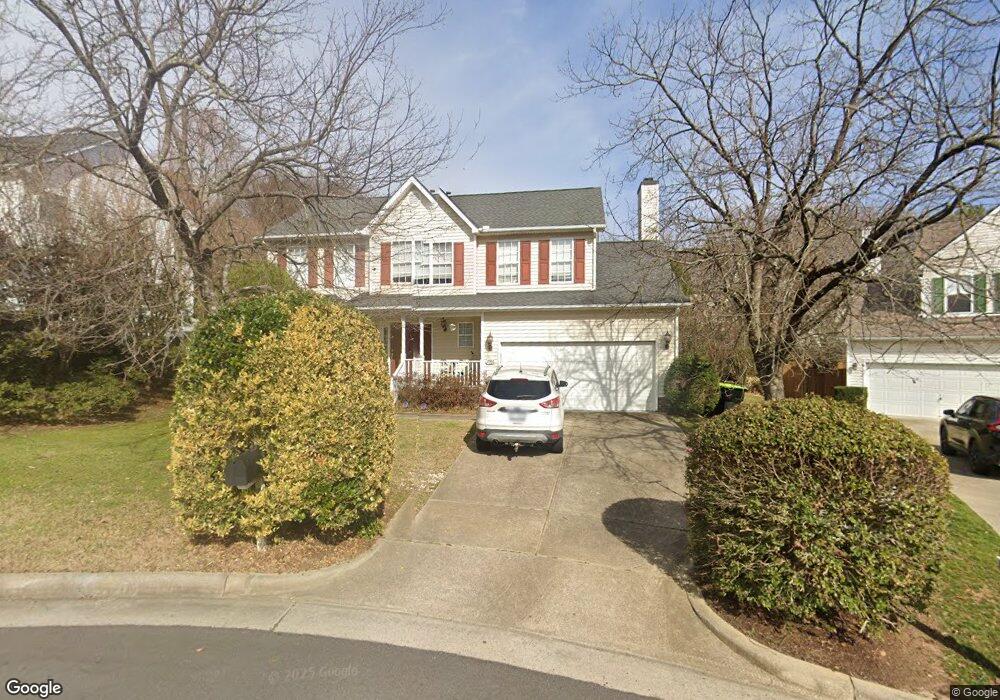
2004 Fitchburg Ct Apex, NC 27523
Beaver Creek NeighborhoodEstimated Value: $668,000 - $714,000
4
Beds
4
Baths
2,933
Sq Ft
$237/Sq Ft
Est. Value
About This Home
This home is located at 2004 Fitchburg Ct, Apex, NC 27523 and is currently estimated at $695,313, approximately $237 per square foot. 2004 Fitchburg Ct is a home located in Wake County with nearby schools including Turner Creek Elementary School, Salem Middle, and Green Level High School.
Ownership History
Date
Name
Owned For
Owner Type
Purchase Details
Closed on
May 24, 2022
Sold by
Willyard Michael S
Bought by
Willyard Michael S
Current Estimated Value
Purchase Details
Closed on
Mar 23, 2018
Sold by
Parker Jeffery A and Parker Laurie L
Bought by
Willyard Machael S and Willyard Zi Liang
Home Financials for this Owner
Home Financials are based on the most recent Mortgage that was taken out on this home.
Original Mortgage
$328,800
Interest Rate
4.38%
Mortgage Type
New Conventional
Purchase Details
Closed on
Feb 10, 2006
Sold by
Thambugala Jayasiri and Thambugala Nilminie R
Bought by
Parker Jeffery A and Parker Laurie L
Home Financials for this Owner
Home Financials are based on the most recent Mortgage that was taken out on this home.
Original Mortgage
$180,800
Interest Rate
6.08%
Mortgage Type
Fannie Mae Freddie Mac
Purchase Details
Closed on
Nov 11, 1997
Sold by
Westminster Homes Of Nc Inc
Bought by
Thambugala Jayasiri and Thambugala Nilminie R
Create a Home Valuation Report for This Property
The Home Valuation Report is an in-depth analysis detailing your home's value as well as a comparison with similar homes in the area
Home Values in the Area
Average Home Value in this Area
Purchase History
| Date | Buyer | Sale Price | Title Company |
|---|---|---|---|
| Willyard Michael S | -- | Rosenberg Jay A | |
| Willyard Michael S | -- | Rosenberg Jay A | |
| Willyard Machael S | $411,000 | None Available | |
| Parker Jeffery A | $226,000 | None Available | |
| Thambugala Jayasiri | $180,000 | -- |
Source: Public Records
Mortgage History
| Date | Status | Borrower | Loan Amount |
|---|---|---|---|
| Previous Owner | Willyard Machael S | $328,800 | |
| Previous Owner | Parker Jeffery A | $180,800 | |
| Previous Owner | Parker Jeffery A | $22,600 |
Source: Public Records
Tax History Compared to Growth
Tax History
| Year | Tax Paid | Tax Assessment Tax Assessment Total Assessment is a certain percentage of the fair market value that is determined by local assessors to be the total taxable value of land and additions on the property. | Land | Improvement |
|---|---|---|---|---|
| 2025 | $5,924 | $676,175 | $215,000 | $461,175 |
| 2024 | $5,791 | $676,175 | $215,000 | $461,175 |
| 2023 | $4,546 | $412,534 | $80,000 | $332,534 |
| 2022 | $4,267 | $412,534 | $80,000 | $332,534 |
| 2021 | $4,104 | $412,534 | $80,000 | $332,534 |
| 2020 | $4,063 | $412,534 | $80,000 | $332,534 |
| 2019 | $3,621 | $317,099 | $80,000 | $237,099 |
| 2018 | $3,411 | $305,179 | $80,000 | $225,179 |
| 2017 | $3,057 | $305,179 | $80,000 | $225,179 |
| 2016 | $2,841 | $287,674 | $80,000 | $207,674 |
| 2015 | $2,659 | $262,676 | $65,000 | $197,676 |
| 2014 | -- | $262,676 | $65,000 | $197,676 |
Source: Public Records
Map
Nearby Homes
- 2201 Dial Dr
- 2300 Walden Creek Dr
- 2208 Good Shepherd Way
- 479 Clark Creek Ln
- 1622 Shepherds Glade Dr
- 1633 Shepherds Glade Dr
- 2122 Grouse Ski Cir
- 2134 Grouse Ski Cir
- 2013 Keokuk Ct
- 2115 Grouse Ski Cir
- 2127 Grouse Ski Cir
- 7242 Morris Acres Rd
- 831 Tunisian Dr
- 2060 Jersey City Place
- 709 Oak Ridge Dr
- 700 Oak Ridge Dr
- 721 Oak Ridge Dr
- 708 Oak Ridge Dr
- 705 Oak Ridge Dr
- 720 Oak Ridge Dr
- 2006 Fitchburg Ct
- 2002 Fitchburg Ct
- 2029 Henniker St
- 2027 Henniker St
- 2031 Henniker St
- 2000 Fitchburg Ct
- 2025 Henniker St
- 2005 Fitchburg Ct
- 2001 Fitchburg Ct
- 2304 Speckled Alder Ct
- 2003 Fitchburg Ct
- 2302 Speckled Alder Ct
- 2304 Dial Dr
- 2101 Henniker St
- 2300 Speckled Alder Ct
- 2306 Dial Dr
- 2306 Speckled Alder Ct
- 2401 Dial Dr
- 2028 Henniker St
- 2030 Henniker St