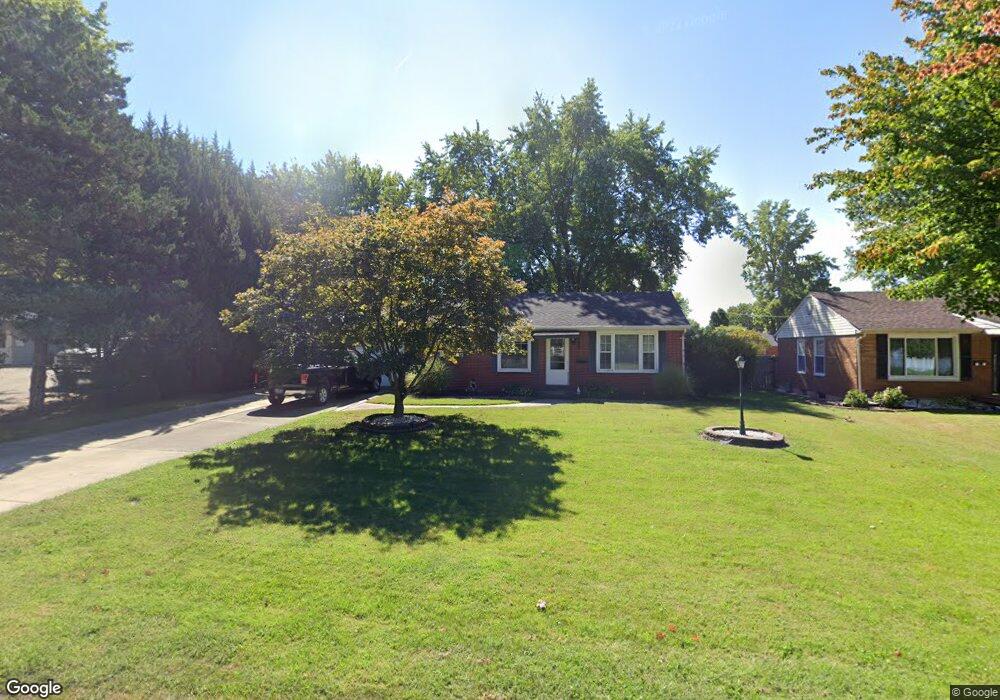
2004 Garfield Ave Granite City, IL 62040
Estimated Value: $125,607 - $146,000
2
Beds
1
Bath
936
Sq Ft
$143/Sq Ft
Est. Value
About This Home
This home is located at 2004 Garfield Ave, Granite City, IL 62040 and is currently estimated at $134,152, approximately $143 per square foot. 2004 Garfield Ave is a home located in Madison County with nearby schools including Granite City High School, Metro East Montessori School, and St. Elizabeth Elementary School.
Ownership History
Date
Name
Owned For
Owner Type
Purchase Details
Closed on
May 20, 2009
Sold by
Stanton Timothy
Bought by
Meehan Matthew
Current Estimated Value
Home Financials for this Owner
Home Financials are based on the most recent Mortgage that was taken out on this home.
Original Mortgage
$73,900
Outstanding Balance
$46,817
Interest Rate
4.9%
Mortgage Type
Purchase Money Mortgage
Estimated Equity
$87,335
Purchase Details
Closed on
Aug 5, 2008
Sold by
Citifinancial Mortgage Co Inc
Bought by
Stanton Timothy
Home Financials for this Owner
Home Financials are based on the most recent Mortgage that was taken out on this home.
Original Mortgage
$70,544
Interest Rate
6.42%
Mortgage Type
FHA
Purchase Details
Closed on
Apr 30, 2008
Sold by
Greene Kenneth M
Bought by
Citifinancial Mortgage Co Inc
Create a Home Valuation Report for This Property
The Home Valuation Report is an in-depth analysis detailing your home's value as well as a comparison with similar homes in the area
Home Values in the Area
Average Home Value in this Area
Purchase History
| Date | Buyer | Sale Price | Title Company |
|---|---|---|---|
| Meehan Matthew | $84,000 | Southern Illinois Real Estat | |
| Stanton Timothy | $71,000 | Fatic | |
| Citifinancial Mortgage Co Inc | -- | None Available |
Source: Public Records
Mortgage History
| Date | Status | Borrower | Loan Amount |
|---|---|---|---|
| Open | Meehan Matthew | $73,900 | |
| Previous Owner | Stanton Timothy | $70,544 |
Source: Public Records
Tax History Compared to Growth
Tax History
| Year | Tax Paid | Tax Assessment Tax Assessment Total Assessment is a certain percentage of the fair market value that is determined by local assessors to be the total taxable value of land and additions on the property. | Land | Improvement |
|---|---|---|---|---|
| 2024 | $2,179 | $39,940 | $7,390 | $32,550 |
| 2023 | $2,179 | $36,000 | $6,660 | $29,340 |
| 2022 | $2,857 | $32,980 | $6,100 | $26,880 |
| 2021 | $2,579 | $30,930 | $5,720 | $25,210 |
| 2020 | $2,490 | $29,540 | $5,460 | $24,080 |
| 2019 | $2,384 | $28,000 | $5,180 | $22,820 |
| 2018 | $2,308 | $27,180 | $5,030 | $22,150 |
| 2017 | $2,264 | $28,190 | $5,220 | $22,970 |
| 2016 | $2,332 | $28,190 | $5,220 | $22,970 |
| 2015 | $2,103 | $28,190 | $5,220 | $22,970 |
| 2014 | $2,103 | $28,190 | $5,220 | $22,970 |
| 2013 | $2,103 | $28,190 | $5,220 | $22,970 |
Source: Public Records
Map
Nearby Homes
- 3424 Lydia Ln
- 3321 Wabash Ave
- 50 Janday Ln
- 9 Mercer Dr
- 3401 Franklin Ave
- 1737 Moro Ave
- 1517 Garfield Ave
- 3805 Fair Oaks Dr
- 1511 Cottage Ave
- 2125 Lynch Ave
- 1612 Mitchell Ave
- 17 Del Rio Ave
- 2125 Woodlawn Ave
- 1728 Ferguson Ave
- 2216 Woodlawn Ave
- 1612 Venice Ave
- 2132 Orville Ave
- 52 Villa Dr
- 1732 Sycamore St
- 3127 Wayne Ave
- 2000 Garfield Ave
- 2006 Garfield Ave
- 2005 Cottage Ave
- 2011 Cottage Ave
- 2001 Cottage Ave
- 2013 Cottage Ave
- 2003 Garfield Ave
- 2001 Garfield Ave
- 2005 Garfield Ave
- 2017 Cottage Ave
- 2007 Garfield Ave
- 2012 Garfield Ave
- 1641 Lindell Blvd
- 2009 Garfield Ave
- 2002 Cottage Ave
- 1643 Lindell Blvd
- 2002 Richmond Ave
- 2021 Cottage Ave
- 2000 Cottage Ave
- 2006 Cottage Ave