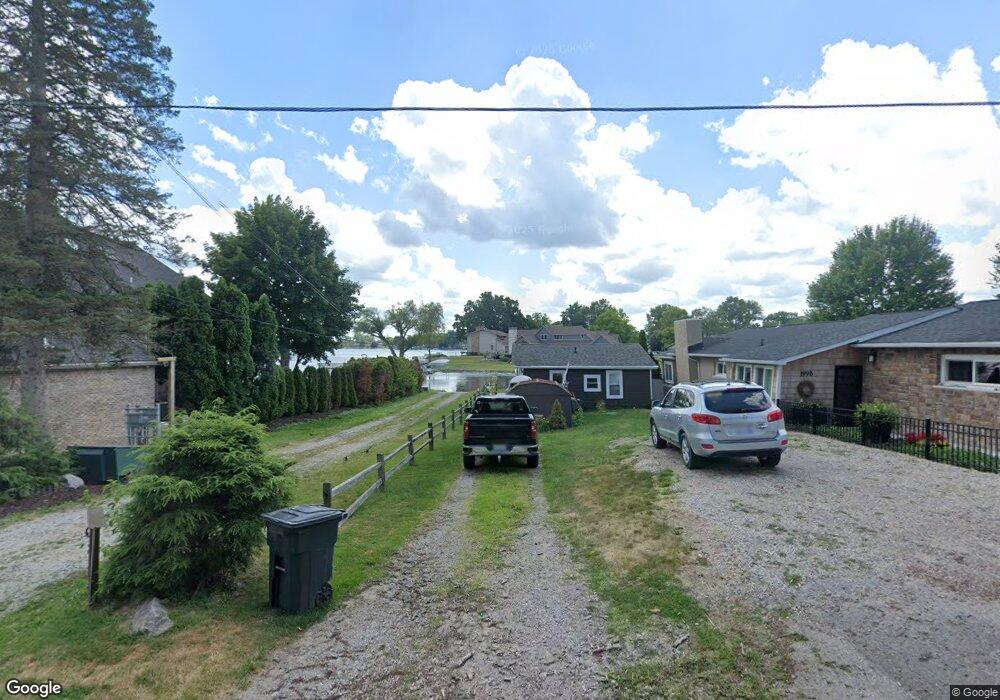
2004 Jackson Blvd Highland, MI 48356
Estimated Value: $166,000 - $250,000
2
Beds
1
Bath
494
Sq Ft
$413/Sq Ft
Est. Value
About This Home
This home is located at 2004 Jackson Blvd, Highland, MI 48356 and is currently estimated at $204,105, approximately $413 per square foot. 2004 Jackson Blvd is a home located in Oakland County with nearby schools including Spring Mills Elementary School.
Ownership History
Date
Name
Owned For
Owner Type
Purchase Details
Closed on
Aug 29, 2025
Sold by
Attard Thomas M and Attard Susan E
Bought by
Attard Thomas M and Attard Susan E
Current Estimated Value
Purchase Details
Closed on
Jul 10, 2019
Sold by
Attard Jessica S
Bought by
Attard Thomas M and Attard Susan E
Home Financials for this Owner
Home Financials are based on the most recent Mortgage that was taken out on this home.
Original Mortgage
$115,000
Interest Rate
3.82%
Mortgage Type
New Conventional
Purchase Details
Closed on
Apr 12, 2011
Sold by
Attard Thomas M and Attard Susan E
Bought by
Attard Thomas M and Attard Susan E
Purchase Details
Closed on
Mar 7, 2005
Sold by
Prosak Thomas
Bought by
Attard Thomas and Attard Susan
Purchase Details
Closed on
Mar 14, 2002
Sold by
J T Gentry Inc
Bought by
Prosak Thomas
Purchase Details
Closed on
Nov 6, 2000
Sold by
Robert E Hunger Tr
Bought by
J T Gentry Inc
Purchase Details
Closed on
Feb 8, 1994
Sold by
Hunger Robert E
Bought by
Robert Hunger Tr
Create a Home Valuation Report for This Property
The Home Valuation Report is an in-depth analysis detailing your home's value as well as a comparison with similar homes in the area
Home Values in the Area
Average Home Value in this Area
Purchase History
| Date | Buyer | Sale Price | Title Company |
|---|---|---|---|
| Attard Thomas M | -- | None Listed On Document | |
| Attard Thomas M | -- | Sterling Title Agency | |
| Attard Thomas M | -- | None Available | |
| Attard Thomas | $160,000 | Metropolitan Title Company | |
| Prosak Thomas | $93,000 | -- | |
| J T Gentry Inc | $37,000 | -- | |
| Robert Hunger Tr | -- | -- |
Source: Public Records
Mortgage History
| Date | Status | Borrower | Loan Amount |
|---|---|---|---|
| Previous Owner | Attard Thomas M | $115,000 | |
| Closed | Prosak Thomas | -- |
Source: Public Records
Tax History
| Year | Tax Paid | Tax Assessment Tax Assessment Total Assessment is a certain percentage of the fair market value that is determined by local assessors to be the total taxable value of land and additions on the property. | Land | Improvement |
|---|---|---|---|---|
| 2025 | $2,879 | $58,560 | $0 | $0 |
| 2024 | $1,834 | $58,750 | $0 | $0 |
| 2023 | $1,749 | $55,970 | $0 | $0 |
| 2022 | $2,626 | $50,110 | $0 | $0 |
| 2021 | $2,661 | $48,240 | $0 | $0 |
| 2020 | $1,575 | $48,240 | $0 | $0 |
| 2019 | $2,451 | $47,060 | $0 | $0 |
| 2018 | $2,537 | $45,960 | $0 | $0 |
| 2017 | $2,254 | $45,960 | $0 | $0 |
| 2016 | $1,351 | $44,990 | $0 | $0 |
| 2015 | -- | $41,300 | $0 | $0 |
| 2014 | -- | $31,840 | $0 | $0 |
| 2011 | -- | $41,770 | $0 | $0 |
Source: Public Records
Map
Nearby Homes
- 2300 Jackson Blvd
- 5291 Bella Dr
- 2286 Davista Dr
- 4333 Hunters Dr
- 3972 Chevron Dr
- 2750 Jackson Blvd
- N/A White Lake Rd
- VL Lot D Chevron Trail
- VL Lot D Trl Chevron Dr
- 2754 Fishermans Dr
- 3426 Maple Ridge
- 3801 Tara Dr
- 3225 Oakridge Dr
- N/A Giddings Blvd
- 3402 Harvey Lake Rd
- 3351 Harvey Lake Rd
- 4031 Hillcrest
- 4730 Bretton Ln
- 5050 Eagle Rd
- 4370 Leroy Ct
- 1998 Jackson Blvd
- 2022 Jackson Blvd
- 1988 Jackson Blvd
- 2028 Jackson Blvd
- 2012 Oakland
- 1982 Jackson Blvd
- 2013 Jackson Blvd
- 2008 Oakland
- 1962 Jackson Blvd
- 2027 Jackson Blvd
- 2000 Oakland
- 4570 Chevron Dr
- 1961 Jackson Blvd
- 2052 Jackson Blvd
- 4565 Chevron Dr
- 1954 Jackson Blvd
- 2041 Jackson Blvd
- 4560 Chevron Dr
- 1924 Jackson Blvd
- 2073 Jackson Blvd
Your Personal Tour Guide
Ask me questions while you tour the home.