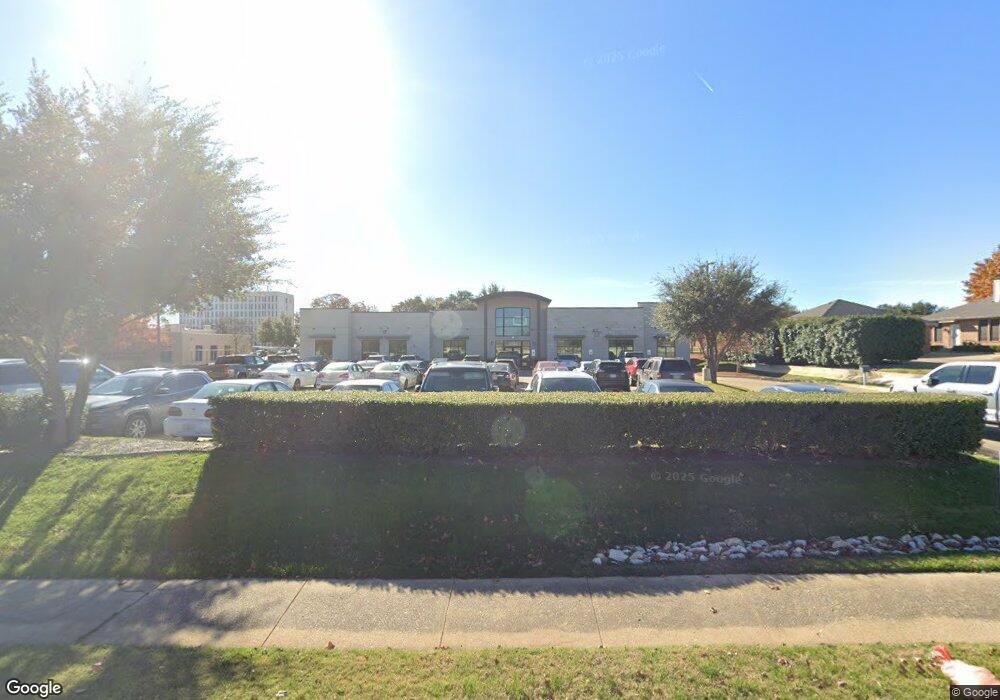
2004 L Don Dodson Dr Bedford, TX 76021
--
Bed
--
Bath
9,785
Sq Ft
1.8
Acres
About This Home
This home is located at 2004 L Don Dodson Dr, Bedford, TX 76021. 2004 L Don Dodson Dr is a home located in Tarrant County with nearby schools including Shady Brook Elementary School, Bedford Junior High School, and L.D. Bell High School.
Ownership History
Date
Name
Owned For
Owner Type
Purchase Details
Closed on
May 30, 2017
Sold by
Dfw Linq Transport Inc
Bought by
Dayer Group Llc
Home Financials for this Owner
Home Financials are based on the most recent Mortgage that was taken out on this home.
Original Mortgage
$1,811,700
Outstanding Balance
$1,507,369
Interest Rate
4.03%
Mortgage Type
Commercial
Purchase Details
Closed on
Apr 20, 2016
Sold by
D & A Bedford Properties Llc
Bought by
Dfw Linq Transport Inc
Home Financials for this Owner
Home Financials are based on the most recent Mortgage that was taken out on this home.
Original Mortgage
$177,500
Interest Rate
3.68%
Mortgage Type
Purchase Money Mortgage
Purchase Details
Closed on
Feb 15, 2008
Sold by
First Bedford Corp
Bought by
D & A Bedford Properties Llc
Home Financials for this Owner
Home Financials are based on the most recent Mortgage that was taken out on this home.
Original Mortgage
$366,500
Interest Rate
5.88%
Mortgage Type
Purchase Money Mortgage
Create a Home Valuation Report for This Property
The Home Valuation Report is an in-depth analysis detailing your home's value as well as a comparison with similar homes in the area
Home Values in the Area
Average Home Value in this Area
Purchase History
| Date | Buyer | Sale Price | Title Company |
|---|---|---|---|
| Dayer Group Llc | -- | Independence Title Co | |
| Dfw Linq Transport Inc | -- | Itc | |
| D & A Bedford Properties Llc | -- | Federal Title Inc |
Source: Public Records
Mortgage History
| Date | Status | Borrower | Loan Amount |
|---|---|---|---|
| Open | Dayer Group Llc | $1,811,700 | |
| Previous Owner | Dfw Linq Transport Inc | $177,500 | |
| Previous Owner | D & A Bedford Properties Llc | $366,500 |
Source: Public Records
Tax History Compared to Growth
Tax History
| Year | Tax Paid | Tax Assessment Tax Assessment Total Assessment is a certain percentage of the fair market value that is determined by local assessors to be the total taxable value of land and additions on the property. | Land | Improvement |
|---|---|---|---|---|
| 2025 | $47,177 | $2,423,200 | $500,252 | $1,922,948 |
| 2024 | $47,177 | $2,423,200 | $411,973 | $2,011,227 |
| 2023 | $40,371 | $2,104,859 | $411,973 | $1,692,886 |
| 2022 | $45,973 | $2,104,859 | $411,973 | $1,692,886 |
| 2021 | $49,582 | $2,104,859 | $411,973 | $1,692,886 |
| 2020 | $50,045 | $2,104,859 | $411,973 | $1,692,886 |
| 2019 | $47,226 | $1,943,948 | $411,973 | $1,531,975 |
| 2018 | $31,767 | $1,307,644 | $411,973 | $895,671 |
| 2017 | $9,966 | $411,973 | $411,973 | $0 |
| 2016 | $9,871 | $408,049 | $408,049 | $0 |
| 2015 | $10,247 | $408,049 | $408,049 | $0 |
| 2014 | $10,247 | $408,049 | $408,049 | $0 |
Source: Public Records
Map
Nearby Homes
- 2024 Oakmeadow St
- 2109 Oakmeadow St
- 2112 Oakmeadow Place
- 1601 Warwickshire Ct W
- 6 Park Ln
- 31 Morrow Dr
- 2503 Shady Ridge Dr
- 2417 Meadow Ct
- 1509 Shirley Way
- 18 Park Ln
- 2300 Folkstone Way
- 2524 Shady Ridge Dr
- 49 Morrow Dr
- 2025 Schumac Ln
- 22 Lincolnshire Cir
- 2201 Greendale Ct
- 2421 Creek Villas Dr
- 2501 Murphy Dr
- 1213 Greendale Dr
- 37 Devonshire Dr
- 2008 L Don Dodson Dr
- 2473 Bedford Cir
- 2465 Bedford Cir
- 2469 Bedford Cir
- 2461 Bedford Cir
- 2000 Parkwood Dr
- 2201 Bedford Cir
- 2457 Bedford Cir
- 2016 L Don Dodson Dr
- 2016 L Don Dodson Dr Unit 2bral
- 2016 L Don Dodson Dr Unit 1BR AL
- 2016 L Don Dodson Dr Unit 1st
- 2205 Bedford Cir
- 2464 Bedford Cir
- 2468 Bedford Cir
- 2460 Bedford Cir
- 2453 Bedford Cir
- 2472 Bedford Cir
- 2209 Bedford Cir
- 2200 Bedford Cir