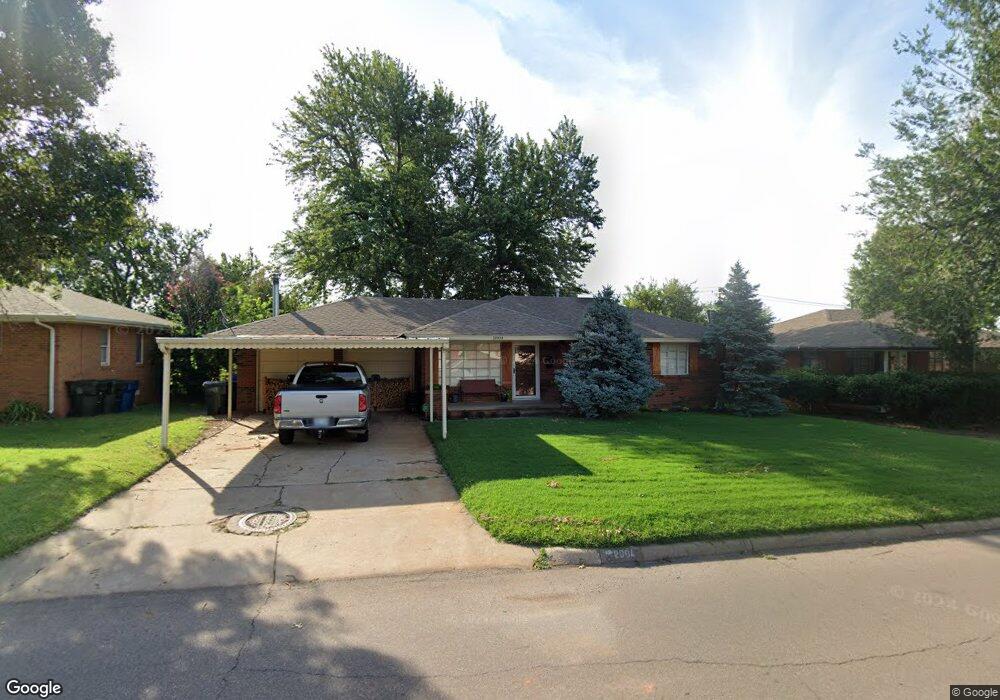
2004 Maple Dr Oklahoma City, OK 73110
Estimated Value: $143,000 - $168,000
3
Beds
1
Bath
1,080
Sq Ft
$140/Sq Ft
Est. Value
About This Home
This home is located at 2004 Maple Dr, Oklahoma City, OK 73110 and is currently estimated at $151,583, approximately $140 per square foot. 2004 Maple Dr is a home located in Oklahoma County with nearby schools including Country Estates Elementary School, Midwest City Middle School, and Midwest City High School.
Ownership History
Date
Name
Owned For
Owner Type
Purchase Details
Closed on
Mar 30, 2022
Sold by
Gray Jackie N and Gray Richard W
Bought by
Gray Jackie N and Moman Brant
Current Estimated Value
Purchase Details
Closed on
Jun 8, 2012
Sold by
Tyler Stephen and Tyler Jennifer
Bought by
Gray Richard W and Gray Jackie
Purchase Details
Closed on
Aug 4, 2004
Sold by
Dean James R
Bought by
Dean James R and Gray Jackie N
Purchase Details
Closed on
Jul 3, 2000
Sold by
Craig Karen J and Craig Timothy
Bought by
Dean James Ray
Home Financials for this Owner
Home Financials are based on the most recent Mortgage that was taken out on this home.
Original Mortgage
$63,300
Interest Rate
8.56%
Mortgage Type
FHA
Purchase Details
Closed on
Aug 17, 1998
Sold by
King Karen and King Larry
Bought by
Gray Karen J
Purchase Details
Closed on
Sep 2, 1997
Sold by
Simmons Edward L and Simmons Jacqueline A
Bought by
King Karen
Create a Home Valuation Report for This Property
The Home Valuation Report is an in-depth analysis detailing your home's value as well as a comparison with similar homes in the area
Home Values in the Area
Average Home Value in this Area
Purchase History
| Date | Buyer | Sale Price | Title Company |
|---|---|---|---|
| Gray Jackie N | -- | None Listed On Document | |
| Gray Richard W | -- | None Available | |
| Dean James R | -- | -- | |
| Dean James Ray | $63,500 | Stewart Escrow & Title | |
| Gray Karen J | $57,500 | Stewart Escrow & Title | |
| King Karen | $48,000 | -- |
Source: Public Records
Mortgage History
| Date | Status | Borrower | Loan Amount |
|---|---|---|---|
| Previous Owner | Dean James Ray | $63,300 |
Source: Public Records
Tax History Compared to Growth
Tax History
| Year | Tax Paid | Tax Assessment Tax Assessment Total Assessment is a certain percentage of the fair market value that is determined by local assessors to be the total taxable value of land and additions on the property. | Land | Improvement |
|---|---|---|---|---|
| 2024 | $1,099 | $10,647 | $2,346 | $8,301 |
| 2023 | $1,099 | $10,337 | $1,728 | $8,609 |
| 2022 | $1,054 | $10,035 | $1,851 | $8,184 |
| 2021 | $1,044 | $9,743 | $2,078 | $7,665 |
| 2020 | $1,039 | $9,460 | $2,252 | $7,208 |
| 2019 | $1,014 | $9,630 | $1,966 | $7,664 |
| 2018 | $920 | $9,350 | $0 | $0 |
| 2017 | $935 | $9,349 | $2,021 | $7,328 |
| 2016 | $935 | $9,129 | $2,021 | $7,108 |
| 2015 | $984 | $9,217 | $2,071 | $7,146 |
| 2014 | $981 | $9,200 | $2,071 | $7,129 |
Source: Public Records
Map
Nearby Homes