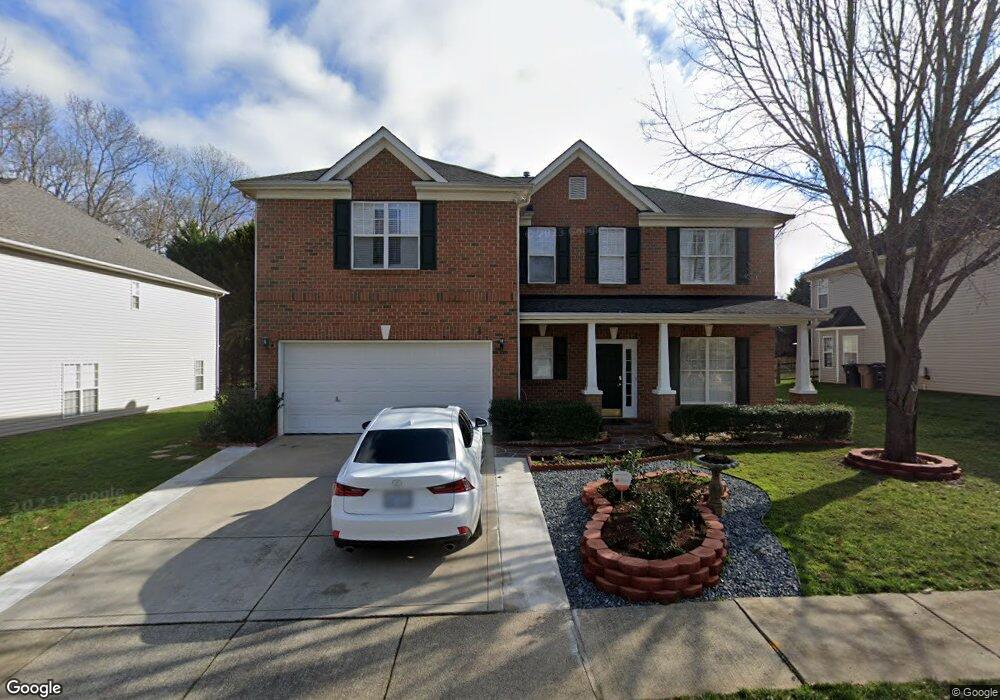
2004 Master Gunner Ct Indian Trail, NC 28079
Estimated Value: $558,000 - $588,151
5
Beds
4
Baths
3,090
Sq Ft
$184/Sq Ft
Est. Value
About This Home
This home is located at 2004 Master Gunner Ct, Indian Trail, NC 28079 and is currently estimated at $568,788, approximately $184 per square foot. 2004 Master Gunner Ct is a home located in Union County with nearby schools including Indian Trail Elementary School, Sun Valley Middle School, and Sun Valley High School.
Ownership History
Date
Name
Owned For
Owner Type
Purchase Details
Closed on
Aug 15, 2012
Sold by
Federal National Mortgag Assn
Bought by
Ismailov Israil and Ismailov Melchribon
Current Estimated Value
Home Financials for this Owner
Home Financials are based on the most recent Mortgage that was taken out on this home.
Original Mortgage
$205,704
Outstanding Balance
$142,024
Interest Rate
3.75%
Mortgage Type
FHA
Estimated Equity
$426,764
Purchase Details
Closed on
May 30, 2012
Sold by
Mcwilliams Jerry
Bought by
Federal National Mortgage Association and Fannie Mae
Purchase Details
Closed on
Jul 19, 2002
Sold by
Mercedes Homes Of The Carolinas Inc
Bought by
Mcwilliams Jerry D
Home Financials for this Owner
Home Financials are based on the most recent Mortgage that was taken out on this home.
Original Mortgage
$196,000
Interest Rate
6.67%
Purchase Details
Closed on
Jul 6, 2001
Sold by
R D H Of Union Llc
Bought by
Garry D Smith Homes Inc
Create a Home Valuation Report for This Property
The Home Valuation Report is an in-depth analysis detailing your home's value as well as a comparison with similar homes in the area
Purchase History
| Date | Buyer | Sale Price | Title Company |
|---|---|---|---|
| Ismailov Israil | -- | None Available | |
| Federal National Mortgage Association | $266,995 | None Available | |
| Mcwilliams Jerry D | $245,000 | -- | |
| Garry D Smith Homes Inc | $201,500 | -- |
Source: Public Records
Mortgage History
| Date | Status | Borrower | Loan Amount |
|---|---|---|---|
| Open | Ismailov Israil | $205,704 | |
| Previous Owner | Mcwilliams Jerry D | $196,000 | |
| Closed | Mcwilliams Jerry D | $49,000 |
Source: Public Records
Tax History
| Year | Tax Paid | Tax Assessment Tax Assessment Total Assessment is a certain percentage of the fair market value that is determined by local assessors to be the total taxable value of land and additions on the property. | Land | Improvement |
|---|---|---|---|---|
| 2025 | $3,860 | $584,300 | $0 | $0 |
| 2024 | $2,923 | $347,300 | $58,000 | $289,300 |
| 2023 | $2,904 | $347,300 | $58,000 | $289,300 |
| 2022 | $2,904 | $347,300 | $58,000 | $289,300 |
| 2021 | $2,902 | $347,300 | $58,000 | $289,300 |
| 2020 | $2,164 | $275,400 | $38,500 | $236,900 |
| 2019 | $2,714 | $275,400 | $38,500 | $236,900 |
| 2018 | $2,100 | $268,800 | $38,500 | $230,300 |
| 2017 | $2,785 | $268,800 | $38,500 | $230,300 |
| 2016 | $2,735 | $268,800 | $38,500 | $230,300 |
| 2015 | $2,224 | $268,800 | $38,500 | $230,300 |
| 2014 | $2,049 | $289,460 | $50,000 | $239,460 |
Source: Public Records
Map
Nearby Homes
- 2525 Whispering Way
- 217 Edenshire Ct
- 227 Edenshire Ct
- 2012 Rosefield Ct
- 1081 Mapletree Ln
- 4208 Blanchard Cir
- 4049 Fincher Rd Unit 3
- 2000 Linstead Dr
- 3007 Linstead Dr
- 333 Kennerly Dr
- 5610 Golden Pond Dr
- 411 Carlisle Dr
- 236 Aylesbury Ln
- 300 Grover Moore Place
- 217 Grover Moore Place
- 1032 Rocking Horse Rd
- 1080 Mapletree Ln
- 1035 Rocking Horse Rd
- 1028 Rocking Horse Rd
- 1036 Rocking Horse Rd
- 2002 Master Gunner Ct
- 2006 Master Gunner Ct
- 1005 Archidamus Ln
- 1007 Archidamus Ln
- 2005 Master Gunner Ct
- 2008 Master Gunner Ct
- 2000 Bianca Dr
- 2003 Master Gunner Ct
- 2003 Bianca Dr
- 2001 Master Gunner Ct
- 2010 Master Gunner Ct
- 1003 Archidamus Ln
- 1008 Archidamus Ln
- 1013 Sentinel Dr
- 2005 Bianca Dr
- 1011 Sentinel Dr
- 1015 Sentinel Dr
- 1018 Master Gunner Ct
- 1009 Sentinel Dr
- 1006 Archidamus Ln
Your Personal Tour Guide
Ask me questions while you tour the home.