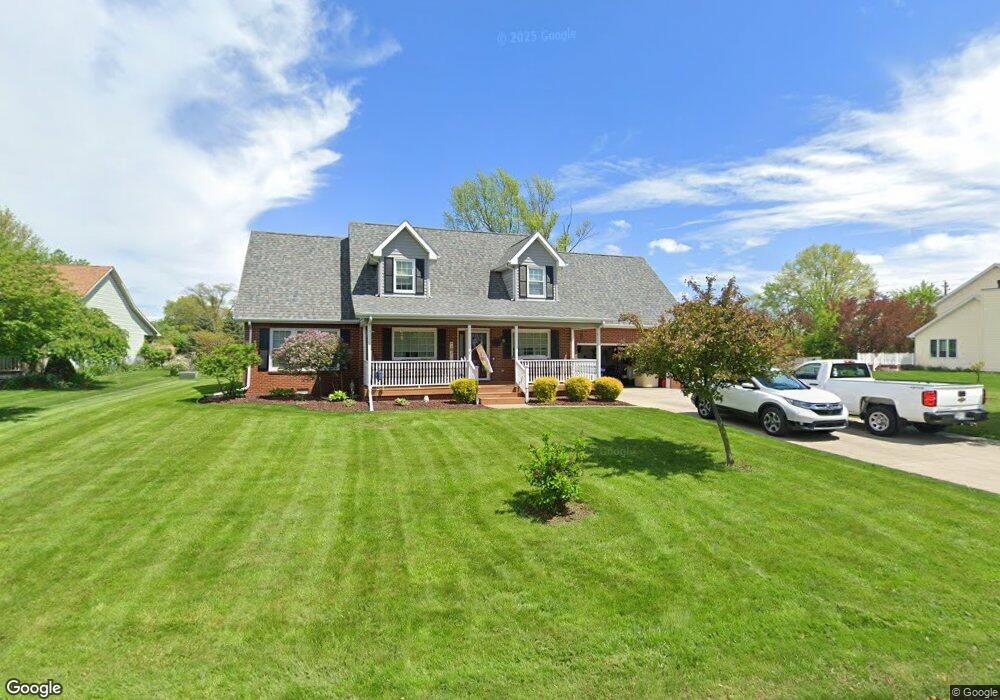
2004 N Carrolton Dr Muncie, IN 47304
Estimated Value: $300,878 - $325,000
4
Beds
3
Baths
2,464
Sq Ft
$127/Sq Ft
Est. Value
About This Home
This home is located at 2004 N Carrolton Dr, Muncie, IN 47304 and is currently estimated at $312,720, approximately $126 per square foot. 2004 N Carrolton Dr is a home located in Delaware County with nearby schools including Pleasant View Elementary School, Yorktown Elementary School, and Yorktown Middle School.
Ownership History
Date
Name
Owned For
Owner Type
Purchase Details
Closed on
Feb 14, 2012
Sold by
Squires Terry K and Brown Terry K
Bought by
Bicknell Terry C and Bicknell Mary K
Current Estimated Value
Home Financials for this Owner
Home Financials are based on the most recent Mortgage that was taken out on this home.
Original Mortgage
$136,451
Outstanding Balance
$93,483
Interest Rate
3.89%
Mortgage Type
FHA
Estimated Equity
$219,237
Purchase Details
Closed on
Feb 3, 2012
Sold by
Zowd Sharon E
Bought by
Squires Terry K and Brown Terry K
Home Financials for this Owner
Home Financials are based on the most recent Mortgage that was taken out on this home.
Original Mortgage
$136,451
Outstanding Balance
$93,483
Interest Rate
3.89%
Mortgage Type
FHA
Estimated Equity
$219,237
Purchase Details
Closed on
Mar 18, 2011
Sold by
Squires Terry K and Brown Terry K
Bought by
Zowd Sharon E
Home Financials for this Owner
Home Financials are based on the most recent Mortgage that was taken out on this home.
Original Mortgage
$149,900
Interest Rate
6.5%
Mortgage Type
Seller Take Back
Create a Home Valuation Report for This Property
The Home Valuation Report is an in-depth analysis detailing your home's value as well as a comparison with similar homes in the area
Home Values in the Area
Average Home Value in this Area
Purchase History
| Date | Buyer | Sale Price | Title Company |
|---|---|---|---|
| Bicknell Terry C | -- | Itic | |
| Squires Terry K | -- | Itic | |
| Zowd Sharon E | $149,900 | Itic |
Source: Public Records
Mortgage History
| Date | Status | Borrower | Loan Amount |
|---|---|---|---|
| Open | Bicknell Terry C | $136,451 | |
| Previous Owner | Zowd Sharon E | $149,900 |
Source: Public Records
Tax History Compared to Growth
Tax History
| Year | Tax Paid | Tax Assessment Tax Assessment Total Assessment is a certain percentage of the fair market value that is determined by local assessors to be the total taxable value of land and additions on the property. | Land | Improvement |
|---|---|---|---|---|
| 2024 | $1,792 | $175,800 | $30,700 | $145,100 |
| 2023 | $1,819 | $175,800 | $30,700 | $145,100 |
| 2022 | $1,834 | $177,400 | $30,700 | $146,700 |
| 2021 | $1,713 | $164,900 | $30,000 | $134,900 |
| 2020 | $1,748 | $168,400 | $30,000 | $138,400 |
| 2019 | $1,597 | $153,300 | $27,300 | $126,000 |
| 2018 | $1,593 | $153,300 | $27,300 | $126,000 |
| 2017 | $1,593 | $155,000 | $29,900 | $125,100 |
| 2016 | $1,555 | $154,100 | $29,000 | $125,100 |
| 2014 | $1,609 | $157,900 | $29,000 | $128,900 |
| 2013 | -- | $156,600 | $29,000 | $127,600 |
Source: Public Records
Map
Nearby Homes
- 8319 W Ashford Ln
- 1509 N Buckeye Rd
- 8701 W Butternut Rd
- 1306 N Balsam Dr
- Lot 27 & 28 W Milk House Ln
- 9410 W Milk House Ln
- 1808 N Sawmill Ln
- 1310 N 500 West Rd
- 9504 Tradition Dr
- 1300 N Tk Way
- 9500 W Thurston Ct
- 8810 W Tulip Tree Dr
- 1821 N Lake Forest Dr
- 1817 N Lake Forest Dr
- 908 N Wild Pine Dr
- 2400 Blk W Mcgalliard Rd
- 8512 W Eucalyptus Ave
- 2304 N Nebo Rd
- 435 N Cherry Wood Ln
- 422 S Bridgewater Ln
- 2000 N Carrolton Dr
- 2100 N Carrolton Dr
- 2005 N Carrolton Dr
- 2101 N Carrolton Dr
- 2001 N Carrolton Dr
- 8500 W Jackson St
- 2104 N Carrolton Dr
- 2105 N Carrolton Dr
- 2108 N Carrolton Dr
- 2109 N Carrolton Dr
- 2005 N Westbrook Dr
- 8509 W Jackson St
- 2001 N Westbrook Dr
- 8501 W Jackson St
- 2101 N Westbrook Dr
- 2200 N Carrolton Dr
- 2201 N Carrolton Dr
- 2105 N Westbrook Dr
- 8605 W Jackson St
- Lot 30 N Carrolton Dr