Estimated Value: $189,000 - $196,000
3
Beds
2
Baths
992
Sq Ft
$194/Sq Ft
Est. Value
About This Home
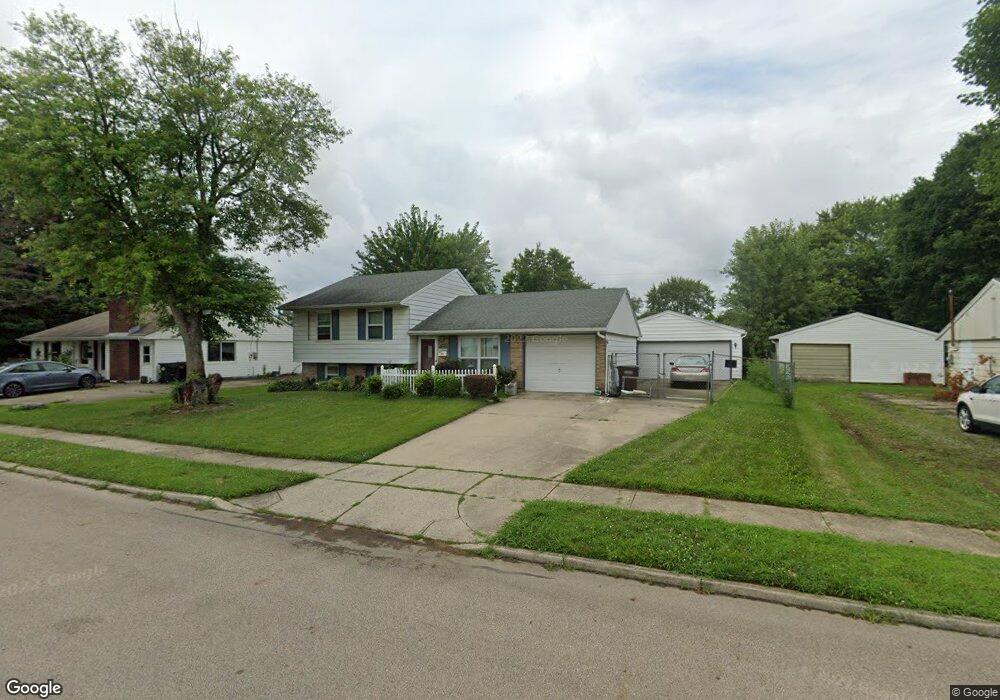
This home is located at 2004 Roxbury Dr, Xenia, OH 45385 and is currently estimated at $192,437, approximately $193 per square foot. 2004 Roxbury Dr is a home located in Greene County with nearby schools including Xenia High School, Summit Academy Community School for Alternative Learners - Xenia, and Legacy Christian Academy.
Ownership History
Date
Name
Owned For
Owner Type
Purchase Details
Closed on
Feb 8, 2013
Sold by
Cassity Doan Jean
Bought by
Cassity Dona Jean
Current Estimated Value
Home Financials for this Owner
Home Financials are based on the most recent Mortgage that was taken out on this home.
Original Mortgage
$36,400
Outstanding Balance
$7,177
Interest Rate
3.38%
Mortgage Type
New Conventional
Estimated Equity
$185,260
Purchase Details
Closed on
Jul 1, 2004
Sold by
Ranly Jesse P and Ranly Sandra A
Bought by
Tramble Patricia A
Home Financials for this Owner
Home Financials are based on the most recent Mortgage that was taken out on this home.
Original Mortgage
$84,700
Interest Rate
6.37%
Mortgage Type
Unknown
Purchase Details
Closed on
Jun 6, 1995
Sold by
Hawkins John P
Bought by
Wells William M and Wells L
Home Financials for this Owner
Home Financials are based on the most recent Mortgage that was taken out on this home.
Original Mortgage
$62,219
Interest Rate
8.26%
Mortgage Type
FHA
Create a Home Valuation Report for This Property
The Home Valuation Report is an in-depth analysis detailing your home's value as well as a comparison with similar homes in the area
Home Values in the Area
Average Home Value in this Area
Purchase History
| Date | Buyer | Sale Price | Title Company |
|---|---|---|---|
| Cassity Dona Jean | -- | None Available | |
| Tramble Patricia A | $105,900 | Ati Title Agency Of Ohio Inc | |
| Wells William M | $62,000 | -- |
Source: Public Records
Mortgage History
| Date | Status | Borrower | Loan Amount |
|---|---|---|---|
| Open | Cassity Dona Jean | $36,400 | |
| Previous Owner | Tramble Patricia A | $84,700 | |
| Previous Owner | Wells William M | $62,219 | |
| Closed | Tramble Patricia A | $21,200 |
Source: Public Records
Tax History Compared to Growth
Tax History
| Year | Tax Paid | Tax Assessment Tax Assessment Total Assessment is a certain percentage of the fair market value that is determined by local assessors to be the total taxable value of land and additions on the property. | Land | Improvement |
|---|---|---|---|---|
| 2024 | $2,200 | $51,410 | $10,270 | $41,140 |
| 2023 | $2,200 | $51,410 | $10,270 | $41,140 |
| 2022 | $1,867 | $37,210 | $6,040 | $31,170 |
| 2021 | $1,892 | $37,210 | $6,040 | $31,170 |
| 2020 | $1,813 | $37,210 | $6,040 | $31,170 |
| 2019 | $1,563 | $30,210 | $6,160 | $24,050 |
| 2018 | $1,569 | $30,210 | $6,160 | $24,050 |
| 2017 | $1,442 | $30,210 | $6,160 | $24,050 |
| 2016 | $1,443 | $27,250 | $6,160 | $21,090 |
| 2015 | $1,447 | $27,250 | $6,160 | $21,090 |
| 2014 | $1,385 | $27,250 | $6,160 | $21,090 |
Source: Public Records
Map
Nearby Homes
- 1255 Colorado Dr
- 1866 Roxbury Dr
- 1908 Whitt St
- 1107 Arkansas Dr
- 2499 Jenny Marie Dr
- 1829 Gayhart Dr
- 1403 Texas Dr
- 1769 Gayhart Dr
- 2540 Jenny Marie Dr
- 2421 Louisiana Dr
- 2540 Cornwall Dr
- 2345 Tennessee Dr
- 1778 Arapaho Dr
- 0 Berkshire Dr Unit 942854
- 2257 Maryland Dr
- 910 Wright Ave
- 2144 Tandem Dr
- 1653 Seneca Dr
- 1618 Navajo Dr
- 2142 Michigan Dr
- 2020 Roxbury Dr
- 1992 Roxbury Dr
- 2049 Westbury Ct
- 1980 Roxbury Dr
- 2035 Westbury Ct
- 2005 Roxbury Dr
- 2040 Roxbury Dr
- 2065 Westbury Ct
- 2021 Roxbury Dr
- 1989 Roxbury Dr
- 1966 Roxbury Dr
- 1977 Roxbury Dr
- 2035 Roxbury Dr
- 2025 Westbury Ct
- 1963 Roxbury Dr
- 2028 Commonwealth Dr
- 2049 Roxbury Dr
- 1954 Roxbury Dr
- 2042 Commonwealth Dr
- 2014 Commonwealth Dr