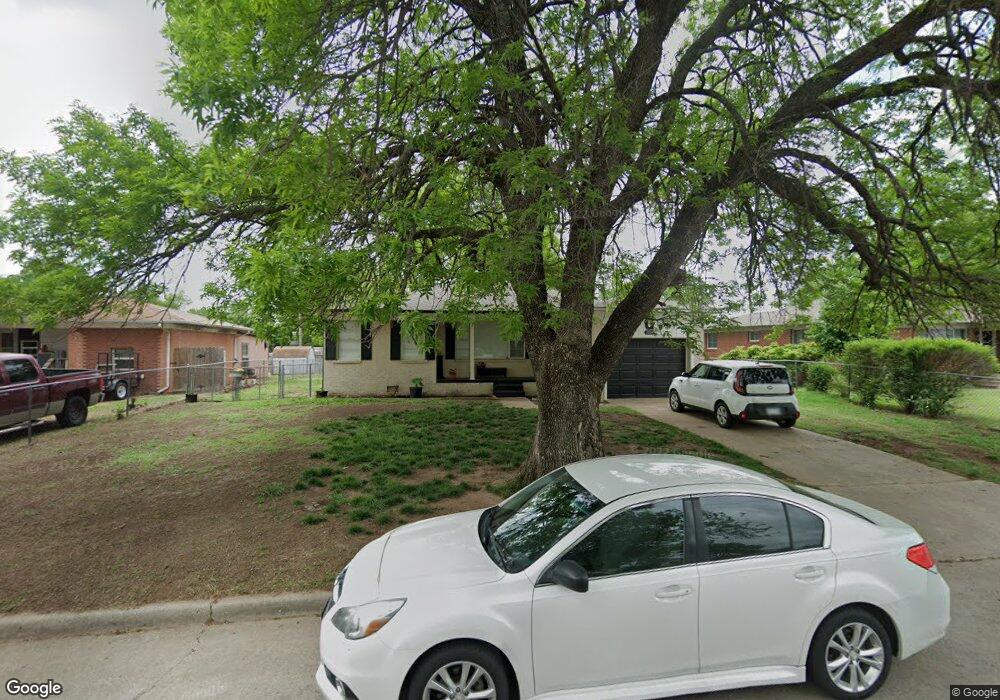
2004 W Randall Ave Duncan, OK 73533
Estimated Value: $116,665 - $132,000
3
Beds
3
Baths
1,250
Sq Ft
$100/Sq Ft
Est. Value
About This Home
This home is located at 2004 W Randall Ave, Duncan, OK 73533 and is currently estimated at $125,166, approximately $100 per square foot. 2004 W Randall Ave is a home with nearby schools including Horace Mann Elementary School, Duncan Middle School, and Duncan High School.
Ownership History
Date
Name
Owned For
Owner Type
Purchase Details
Closed on
Jun 20, 2025
Sold by
Prestige Property Group Llc
Bought by
Jeffords Kathryn
Current Estimated Value
Home Financials for this Owner
Home Financials are based on the most recent Mortgage that was taken out on this home.
Original Mortgage
$126,564
Outstanding Balance
$126,236
Interest Rate
6.76%
Mortgage Type
FHA
Estimated Equity
-$1,070
Purchase Details
Closed on
Jan 10, 2022
Sold by
Edwards Tommy W and Edwards Cynthia
Bought by
Prestige Property Group Llc
Purchase Details
Closed on
Mar 14, 2008
Sold by
C & F Enterprises and Carnahan Janice Elaine
Bought by
Edwards Tommy W and Edwards Brenda A
Home Financials for this Owner
Home Financials are based on the most recent Mortgage that was taken out on this home.
Original Mortgage
$56,000
Interest Rate
5.72%
Mortgage Type
New Conventional
Purchase Details
Closed on
Feb 9, 2007
Sold by
Wade Loretta
Bought by
C & F Enterprises
Purchase Details
Closed on
Jan 23, 2006
Sold by
Edith Bolt Margaret Laura and Early Laura
Bought by
Wade Loretta
Home Financials for this Owner
Home Financials are based on the most recent Mortgage that was taken out on this home.
Original Mortgage
$44,790
Interest Rate
6.36%
Mortgage Type
Purchase Money Mortgage
Create a Home Valuation Report for This Property
The Home Valuation Report is an in-depth analysis detailing your home's value as well as a comparison with similar homes in the area
Home Values in the Area
Average Home Value in this Area
Purchase History
| Date | Buyer | Sale Price | Title Company |
|---|---|---|---|
| Jeffords Kathryn | $129,000 | Old Republic Title | |
| Jeffords Kathryn | $129,000 | Old Republic Title | |
| Prestige Property Group Llc | $13,333 | None Listed On Document | |
| Edwards Tommy W | $72,000 | None Available | |
| C & F Enterprises | $4,720,000 | None Available | |
| Wade Loretta | -- | None Available |
Source: Public Records
Mortgage History
| Date | Status | Borrower | Loan Amount |
|---|---|---|---|
| Open | Jeffords Kathryn | $126,564 | |
| Closed | Jeffords Kathryn | $126,564 | |
| Previous Owner | Edwards Tommy W | $56,000 | |
| Previous Owner | Wade Loretta | $44,790 |
Source: Public Records
Tax History Compared to Growth
Tax History
| Year | Tax Paid | Tax Assessment Tax Assessment Total Assessment is a certain percentage of the fair market value that is determined by local assessors to be the total taxable value of land and additions on the property. | Land | Improvement |
|---|---|---|---|---|
| 2025 | $658 | $7,381 | $602 | $6,779 |
| 2024 | $658 | $7,725 | $602 | $7,123 |
| 2023 | $658 | $7,817 | $602 | $7,215 |
| 2022 | $445 | $6,547 | $602 | $5,945 |
| 2021 | $446 | $5,239 | $602 | $4,637 |
| 2020 | $410 | $4,752 | $602 | $4,150 |
| 2019 | $408 | $4,717 | $602 | $4,115 |
| 2018 | $420 | $4,717 | $602 | $4,115 |
| 2017 | $517 | $6,020 | $602 | $5,418 |
| 2016 | $577 | $6,784 | $602 | $6,182 |
| 2015 | $645 | $6,784 | $602 | $6,182 |
| 2014 | $645 | $6,784 | $602 | $6,182 |
Source: Public Records
Map
Nearby Homes
- 1902 W Randall Ave
- 1212 1212 N 21st
- 2110 W Amhurst Ave
- 1099 N 19th St
- 1302 N 21st St
- 1929 W Chisholm Dr
- 1807 W Chisholm Dr
- 1311 1311 N 20 St
- 2204 W Parkview Ave
- 2206 2206 W Spruce
- 2230 W Spruce St
- 2202 W Canary Ave
- 812 N 15th St
- 2120 2120 Flamingo Ln
- 2210 Western Dr
- 815 N 14th St
- 507 N Alice Dr
- 1114 N 13th St
- 1402 1402 W Elk Ave
- 1405 Evergreen Dr
- 2006 W Randall Ave
- 2002 W Randall Ave
- 2001 W Randall Ave
- 2008 W Randall Ave
- 1903 W Chisholm Dr
- 1201 N 20th St
- 1905 W Chisholm Dr
- 1908 W Randall Ave
- 1908 W Randall Ave
- 1204 N 20th St
- 1907 W Chisholm Dr
- 2010 W Randall Ave
- 2010 Randall Ave
- 1203 N 20th St
- 1201 N 19th St
- 1823 W Chisholm Dr
- 1909 W Chisholm Dr
- 1906 W Randall Ave
- 1206 N 20th St
- 1203 N 19th St