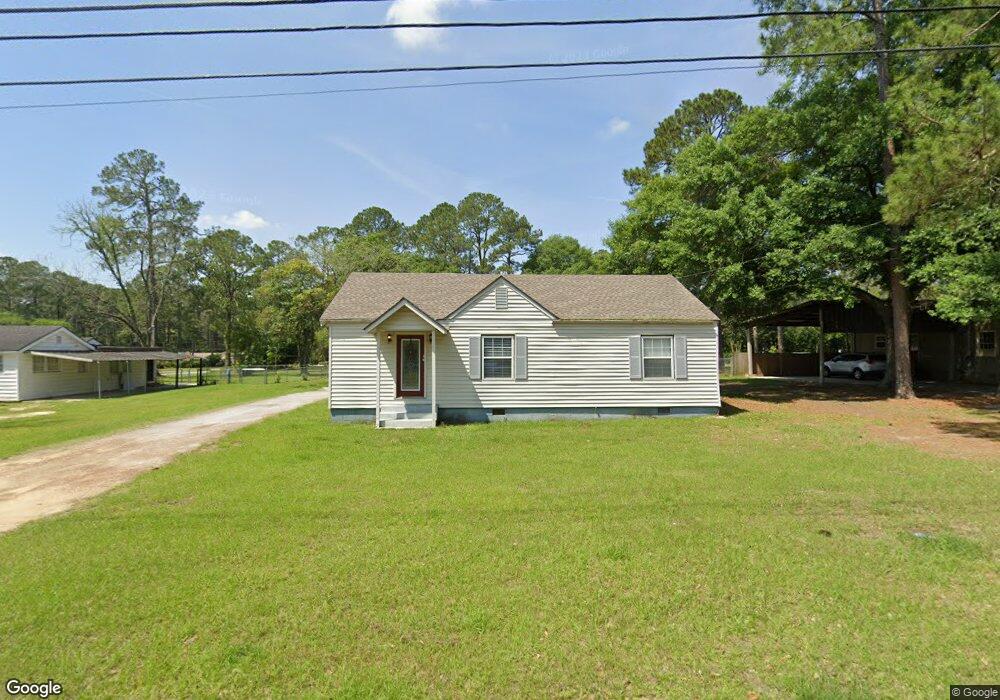
2004 Wilson Ave N Tifton, GA 31794
Estimated Value: $160,000 - $229,000
3
Beds
2
Baths
1,382
Sq Ft
$144/Sq Ft
Est. Value
About This Home
This home is located at 2004 Wilson Ave N, Tifton, GA 31794 and is currently estimated at $198,751, approximately $143 per square foot. 2004 Wilson Ave N is a home located in Tift County with nearby schools including Len Lastinger Primary School, Charles Spencer Elementary School, and J.T. Reddick School.
Ownership History
Date
Name
Owned For
Owner Type
Purchase Details
Closed on
Oct 31, 2023
Sold by
Selph Brandi
Bought by
Melendez Jose and Selph Brandi
Current Estimated Value
Purchase Details
Closed on
Sep 2, 2014
Sold by
Bishop Ruth J
Bought by
Selph Brandi
Home Financials for this Owner
Home Financials are based on the most recent Mortgage that was taken out on this home.
Original Mortgage
$72,448
Interest Rate
4.2%
Mortgage Type
New Conventional
Purchase Details
Closed on
Mar 10, 1989
Sold by
Bishop and Clenon E
Bought by
Bishop Clennon E and Bishop Ruth J
Purchase Details
Closed on
Nov 24, 1950
Sold by
Flint Homes Inc
Bought by
Bishop Clenon E
Create a Home Valuation Report for This Property
The Home Valuation Report is an in-depth analysis detailing your home's value as well as a comparison with similar homes in the area
Home Values in the Area
Average Home Value in this Area
Purchase History
| Date | Buyer | Sale Price | Title Company |
|---|---|---|---|
| Melendez Jose | -- | -- | |
| Selph Brandi | $71,000 | -- | |
| Bishop Clennon E | -- | -- | |
| Bishop Clenon E | -- | -- |
Source: Public Records
Mortgage History
| Date | Status | Borrower | Loan Amount |
|---|---|---|---|
| Previous Owner | Selph Brandi | $72,448 |
Source: Public Records
Tax History Compared to Growth
Tax History
| Year | Tax Paid | Tax Assessment Tax Assessment Total Assessment is a certain percentage of the fair market value that is determined by local assessors to be the total taxable value of land and additions on the property. | Land | Improvement |
|---|---|---|---|---|
| 2024 | $1,586 | $62,664 | $8,000 | $54,664 |
| 2023 | $1,420 | $36,087 | $6,000 | $30,087 |
| 2022 | $1,209 | $36,087 | $6,000 | $30,087 |
| 2021 | $1,216 | $36,087 | $6,000 | $30,087 |
| 2020 | $1,035 | $30,655 | $6,000 | $24,655 |
| 2019 | $1,035 | $30,655 | $6,000 | $24,655 |
| 2018 | $1,035 | $30,655 | $6,000 | $24,655 |
| 2017 | $1,064 | $30,655 | $6,000 | $24,655 |
| 2016 | $985 | $28,632 | $6,000 | $22,632 |
| 2015 | $1,135 | $29,250 | $6,000 | $23,250 |
| 2014 | $822 | $29,250 | $6,000 | $23,250 |
| 2013 | -- | $29,250 | $6,000 | $23,250 |
Source: Public Records
Map
Nearby Homes
- 1617 Wilson Ave N
- 2021 Emory Dr
- 1601 Murray Ave
- 2202 Emory Dr
- 2214 Love Ave
- 0 Central Ave Unit 138182
- 0 Central Ave Unit 137897
- 0 Central Ave Unit 137896
- 0 Central Ave Unit 137898
- 0 Central Ave Unit 137895
- 1611 Love Ave
- 2609 Emmett Dr
- 0 Tift Ave
- 0 N U S Hwy 41
- 502 20th St E
- 15 acres Us Highway 41
- 33.7 ac Us Highway 41
- 48 acres Us Highway 41
- 711 10th St W
- 821 Murray Ave
- 2006 Wilson Ave N
- 505 20th St W
- 2003 Murray Ave
- 307 20th St W
- 511 20th St W
- 2005 Murray Ave
- 2005 Wilson Ave N
- 2007 Murray Ave
- 2010 Wilson Ave N
- 504 20th St W
- 508 20th St W
- 2007 Wilson Ave N
- 402 22nd St W
- 305 20th St W
- 2009 Murray Ave
- 512 20th St W
- 2012 Wilson Ave N
- 2009 Wilson Ave N
- 1818 Wilson Ave N
- 2021 Murray Ave