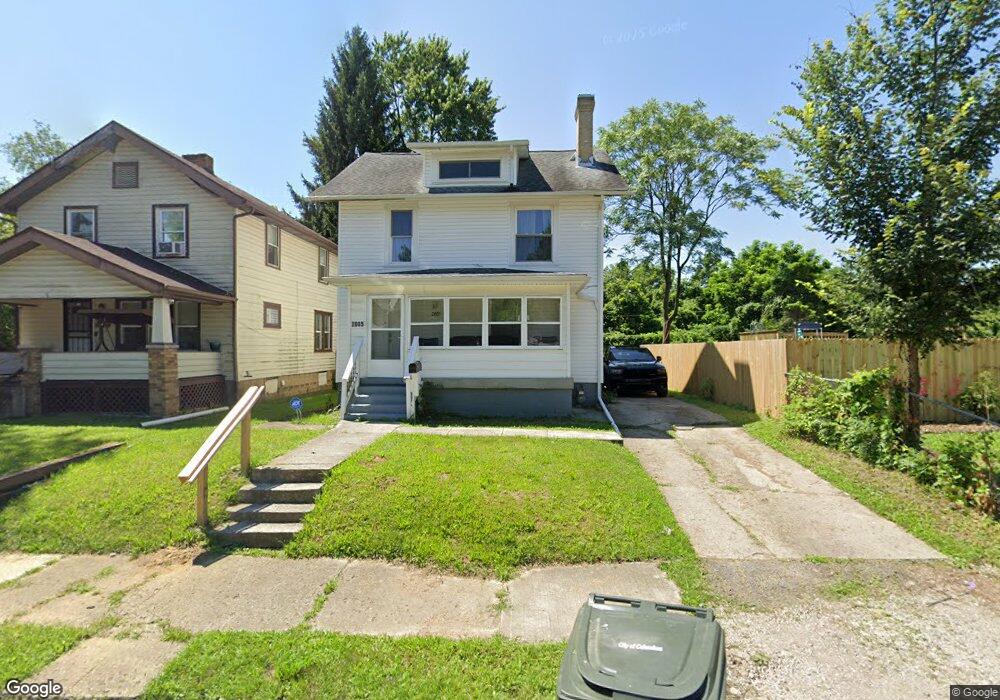
2005 Aberdeen Ave Columbus, OH 43211
East Linden NeighborhoodEstimated Value: $128,750 - $189,000
3
Beds
2
Baths
1,332
Sq Ft
$117/Sq Ft
Est. Value
About This Home
This home is located at 2005 Aberdeen Ave, Columbus, OH 43211 and is currently estimated at $155,188, approximately $116 per square foot. 2005 Aberdeen Ave is a home located in Franklin County with nearby schools including Linden STEM Academy (K-6), Linden-Mckinley Stem School On Arcadia, and Focus Learning Academy of Central Columbus.
Ownership History
Date
Name
Owned For
Owner Type
Purchase Details
Closed on
Jun 29, 2022
Sold by
J & L Homes Llc
Bought by
J & L Homes 1 Llc
Current Estimated Value
Home Financials for this Owner
Home Financials are based on the most recent Mortgage that was taken out on this home.
Original Mortgage
$705,000
Outstanding Balance
$456,906
Interest Rate
2.8%
Mortgage Type
Credit Line Revolving
Estimated Equity
-$301,718
Purchase Details
Closed on
May 12, 2021
Sold by
Daniels Larry D
Bought by
J & L Homes Llc
Purchase Details
Closed on
Nov 25, 2020
Sold by
Daniels Janet M and Daniels Janet
Bought by
Daniels Robert L
Purchase Details
Closed on
Aug 26, 2020
Sold by
Estate Of Robert Lee Daniels Sr
Bought by
Daniels Janet M
Purchase Details
Closed on
May 5, 1976
Bought by
Daniels Robert L
Create a Home Valuation Report for This Property
The Home Valuation Report is an in-depth analysis detailing your home's value as well as a comparison with similar homes in the area
Home Values in the Area
Average Home Value in this Area
Purchase History
| Date | Buyer | Sale Price | Title Company |
|---|---|---|---|
| J & L Homes 1 Llc | -- | Bc Law Firm Pa | |
| J & L Homes Llc | $59,000 | Axxis Title Agency Ltd | |
| Daniels Robert L | -- | Ceba Title Llc | |
| Daniels Janet M | -- | None Available | |
| Daniels Robert L | -- | -- |
Source: Public Records
Mortgage History
| Date | Status | Borrower | Loan Amount |
|---|---|---|---|
| Open | J & L Homes 1 Llc | $705,000 |
Source: Public Records
Tax History
| Year | Tax Paid | Tax Assessment Tax Assessment Total Assessment is a certain percentage of the fair market value that is determined by local assessors to be the total taxable value of land and additions on the property. | Land | Improvement |
|---|---|---|---|---|
| 2025 | $2,188 | $47,740 | $6,300 | $41,440 |
| 2024 | $2,188 | $47,740 | $6,300 | $41,440 |
| 2023 | $2,161 | $47,740 | $6,300 | $41,440 |
| 2022 | $980 | $18,450 | $1,650 | $16,800 |
| 2021 | $982 | $18,450 | $1,650 | $16,800 |
| 2020 | $457 | $18,450 | $1,650 | $16,800 |
| 2019 | $417 | $15,620 | $1,440 | $14,180 |
| 2018 | $479 | $15,620 | $1,440 | $14,180 |
| 2017 | $507 | $15,620 | $1,440 | $14,180 |
| 2016 | $598 | $17,780 | $2,100 | $15,680 |
| 2015 | $543 | $17,780 | $2,100 | $15,680 |
| 2014 | $544 | $17,780 | $2,100 | $15,680 |
| 2013 | $361 | $20,895 | $2,450 | $18,445 |
Source: Public Records
Map
Nearby Homes
- 2475 Parkwood Ave
- 2480 Parkwood Ave
- 2055 Earl Ave
- 1938 Myrtle Ave
- 1884 Aberdeen Ave
- 1827 Aberdeen Ave
- 1326 Minnesota Ave
- 2735 Berrell Ave
- 2291 Taylor Ave
- 2765 Joyce Ave
- 2407 Marcia Dr
- 1799 Harold Place
- 0 Parkwood Ave
- 0 Aberdeen Ave Unit 226000728
- 0 Aberdeen Ave Unit 226002456
- 0 Aberdeen Ave Unit 226002459
- 0 Aberdeen Ave Unit 226002457
- 0 Aberdeen Ave Unit 226002458
- 2823 Fern Ave
- 1864 E Hudson St
- 2011 Aberdeen Ave
- 1999 Aberdeen Ave
- 2017 Aberdeen Ave
- 1991 Aberdeen Ave
- 2025 Aberdeen Ave
- 2016 Minnesota Ave
- 2006 Aberdeen Ave
- 1981 Aberdeen Ave
- 2016 Aberdeen Ave
- 3807 Charbonnet Ct
- 1994 Aberdeen Ave
- 1975 Aberdeen Ave
- 2028 Aberdeen Ave
- 1986 Aberdeen Ave
- 2547 Parkwood Ave Unit 549
- 2547-2549 Parkwood Ave
- 2547-2549 Parkwood Ave Unit 549
- 2537 Parkwood Ave Unit 539
- 2537 Parkwood Ave
- 2557 Parkwood Ave Unit 559
Your Personal Tour Guide
Ask me questions while you tour the home.