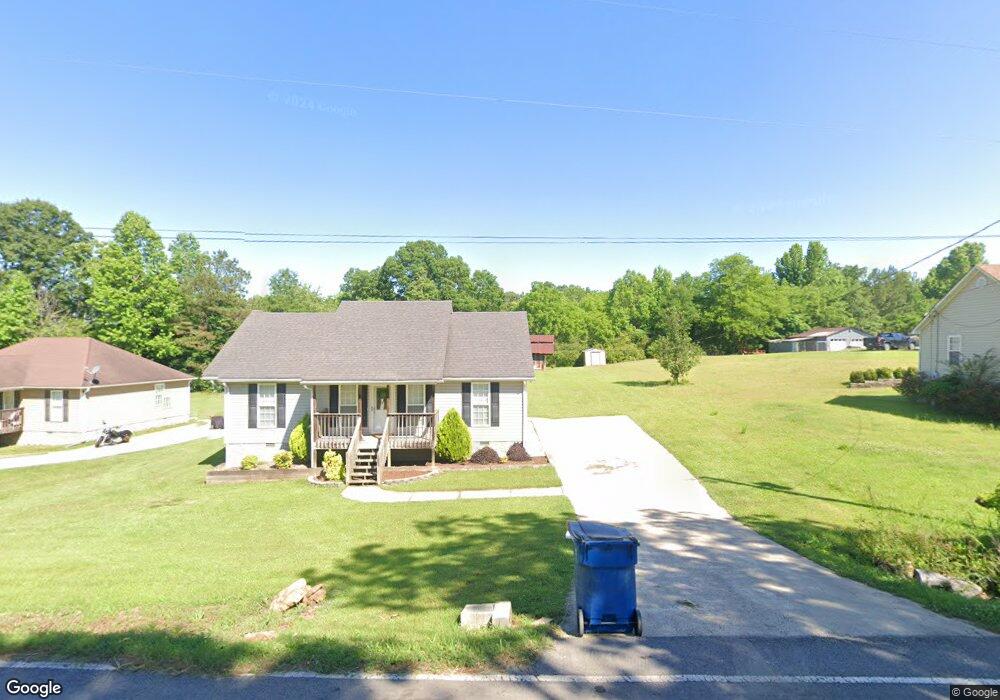
2005 Armstrong Loop Unit 4 Hayden, AL 35079
Estimated Value: $204,540 - $247,000
3
Beds
2
Baths
1,107
Sq Ft
$205/Sq Ft
Est. Value
About This Home
This home is located at 2005 Armstrong Loop Unit 4, Hayden, AL 35079 and is currently estimated at $226,635, approximately $204 per square foot. 2005 Armstrong Loop Unit 4 is a home located in Blount County with nearby schools including Hayden Primary School, Hayden Elementary School, and Hayden Middle School.
Ownership History
Date
Name
Owned For
Owner Type
Purchase Details
Closed on
Mar 28, 2024
Sold by
Lindsey Caleb Bradford and Lindsey Lauren Amber
Bought by
Newsome Emily Grace
Current Estimated Value
Home Financials for this Owner
Home Financials are based on the most recent Mortgage that was taken out on this home.
Original Mortgage
$198,242
Outstanding Balance
$194,463
Interest Rate
6.77%
Mortgage Type
FHA
Estimated Equity
$32,172
Purchase Details
Closed on
Nov 29, 2021
Sold by
Bradford Lindsey Caleb
Bought by
Lindsey Caleb Bradford and Lindsey Lauren Amber
Home Financials for this Owner
Home Financials are based on the most recent Mortgage that was taken out on this home.
Original Mortgage
$118,400
Interest Rate
3.14%
Mortgage Type
New Conventional
Purchase Details
Closed on
May 2, 2018
Sold by
Richey Kathy
Bought by
Wiley Judy
Purchase Details
Closed on
May 13, 2010
Sold by
Teal Construction Llc
Bought by
Richey Joshua Ray
Create a Home Valuation Report for This Property
The Home Valuation Report is an in-depth analysis detailing your home's value as well as a comparison with similar homes in the area
Purchase History
| Date | Buyer | Sale Price | Title Company |
|---|---|---|---|
| Newsome Emily Grace | $201,900 | None Listed On Document | |
| Lindsey Caleb Bradford | $10,900 | Rosenberg Pllc | |
| Wiley Judy | -- | -- | |
| Richey Joshua Ray | -- | -- |
Source: Public Records
Mortgage History
| Date | Status | Borrower | Loan Amount |
|---|---|---|---|
| Open | Newsome Emily Grace | $198,242 | |
| Previous Owner | Lindsey Caleb Bradford | $118,400 |
Source: Public Records
Tax History
| Year | Tax Paid | Tax Assessment Tax Assessment Total Assessment is a certain percentage of the fair market value that is determined by local assessors to be the total taxable value of land and additions on the property. | Land | Improvement |
|---|---|---|---|---|
| 2024 | $476 | $14,740 | $1,500 | $13,240 |
| 2023 | $421 | $14,560 | $1,000 | $13,560 |
| 2022 | $340 | $12,240 | $1,000 | $11,240 |
| 2021 | $305 | $11,180 | $1,100 | $10,080 |
| 2020 | $288 | $9,660 | $1,080 | $8,580 |
| 2019 | $311 | $9,580 | $1,000 | $8,580 |
| 2018 | $248 | $9,420 | $1,000 | $8,420 |
| 2017 | $226 | $8,740 | $0 | $0 |
| 2015 | $219 | $8,520 | $0 | $0 |
| 2014 | $219 | $8,520 | $0 | $0 |
| 2013 | -- | $8,460 | $0 | $0 |
Source: Public Records
Map
Nearby Homes
- 320 Willow Ln
- 252 Bailey Way
- 125 Bailey Way
- 370 River Oak Trail
- 330 Nicole Trail
- 198 Nicole Trail
- 140 Armstrong Loop
- 41 Armstrong Loop
- 640 Gilman Bend Rd
- 00 Alabama 160
- 857 Peach Cir
- 000 Alabama 160
- 339 Cox Cove Rd
- 345 Cox Cove Rd
- 75 Chestnut View
- 1259 Railroad Dr
- 115 Quail Hollow Rd
- 176 Quail Hollow Rd
- 284 Deer Crossing Rd
- 100 Miranda Rd
- 2005 Armstrong Loop
- 2029 Armstrong Loop
- 1985 Armstrong Loop
- 2045 Armstrong Loop
- 0 Armstrong Loop Rd Unit 9.9 796022
- 0 Armstrong Loop Rd Unit 456838
- 0 Armstrong Loop Rd Unit 394669
- 0 Armstrong Loop Rd Unit 435404
- 1990 Armstrong Loop
- 2067 Armstrong Loop
- 17 Willow Ln
- 25 Willow Parc Dr Unit 25
- 19 Willow Parc Dr Unit 19
- 13 Willow Parc Dr Unit 13
- 3 Willow Parc Dr Unit 3
- 2190 Armstrong Loop
- 24 Willow Park Dr Unit 24
- 24 Willow Parc Dr Unit 24
- 20 Willow Ln
- 14 Willow Park Dr Unit 14
Your Personal Tour Guide
Ask me questions while you tour the home.