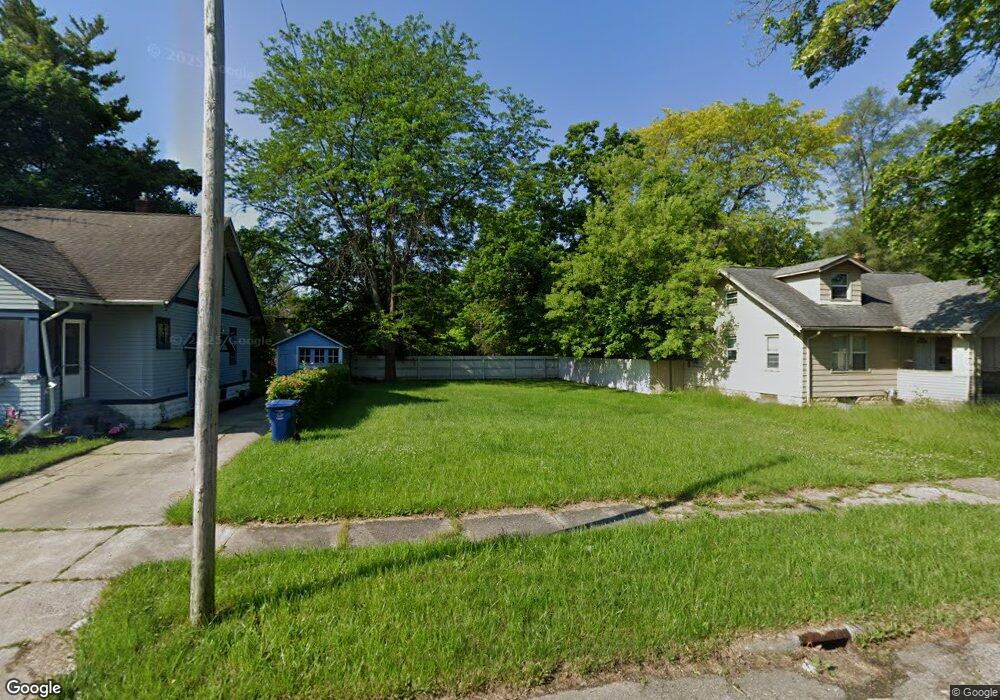
2005 Begole St Flint, MI 48504
Metawanne Hills NeighborhoodEstimated Value: $38,000 - $90,466
3
Beds
1
Bath
955
Sq Ft
$62/Sq Ft
Est. Value
About This Home
This home is located at 2005 Begole St, Flint, MI 48504 and is currently estimated at $58,867, approximately $61 per square foot. 2005 Begole St is a home located in Genesee County with nearby schools including Brownell STEM Academy, St John Vianney Catholic School, and St. Paul Lutheran School.
Ownership History
Date
Name
Owned For
Owner Type
Purchase Details
Closed on
Jun 23, 2015
Sold by
Genesee County Land Bank Authority
Bought by
Jackson Harlan and Jackson Cheryl T
Current Estimated Value
Purchase Details
Closed on
Dec 20, 2012
Sold by
Cherry Deborah L
Bought by
Genesee County Land Bank
Purchase Details
Closed on
Feb 1, 2010
Sold by
Houston Fannie F
Bought by
Dawson Edward
Purchase Details
Closed on
Aug 6, 2008
Sold by
Dudley David L
Bought by
Houston Fannie Fay
Purchase Details
Closed on
Aug 17, 2007
Sold by
Johnson Edna
Bought by
Wells Fargo Bank Na and Certificateholders Of Asset Backed Pass
Purchase Details
Closed on
Apr 27, 2004
Sold by
Koski Gary
Bought by
Johnson Edna
Purchase Details
Closed on
Jan 15, 2003
Sold by
Ivy Hill Investments Inc
Bought by
Koski Gary
Purchase Details
Closed on
May 14, 2001
Sold by
Eastern Svgs Bank Fsb
Bought by
Ivy Hill Investments Inc
Purchase Details
Closed on
Apr 11, 2001
Sold by
Miller Valerie M
Bought by
Eastern Svgs Bank Fsb
Create a Home Valuation Report for This Property
The Home Valuation Report is an in-depth analysis detailing your home's value as well as a comparison with similar homes in the area
Home Values in the Area
Average Home Value in this Area
Purchase History
| Date | Buyer | Sale Price | Title Company |
|---|---|---|---|
| Jackson Harlan | -- | None Available | |
| Genesee County Land Bank | -- | None Available | |
| Dawson Edward | -- | Sargents Title Company | |
| Houston Fannie Fay | -- | Sargents Title Company | |
| Wells Fargo Bank Na | $14,400 | None Available | |
| Johnson Edna | $75,000 | Titlequest Agency | |
| Koski Gary | $10,000 | Cislo Title Company | |
| Ivy Hill Investments Inc | -- | -- | |
| Eastern Svgs Bank Fsb | $35,000 | -- |
Source: Public Records
Tax History
| Year | Tax Paid | Tax Assessment Tax Assessment Total Assessment is a certain percentage of the fair market value that is determined by local assessors to be the total taxable value of land and additions on the property. | Land | Improvement |
|---|---|---|---|---|
| 2025 | $133 | $2,500 | $0 | $0 |
| 2024 | $124 | $2,100 | $0 | $0 |
| 2023 | $131 | $1,800 | $0 | $0 |
| 2022 | $0 | $1,600 | $0 | $0 |
| 2021 | $164 | $1,500 | $0 | $0 |
| 2020 | $154 | $1,300 | $0 | $0 |
| 2019 | $161 | $1,500 | $0 | $0 |
| 2018 | $128 | $1,100 | $0 | $0 |
| 2017 | $56 | $0 | $0 | $0 |
| 2016 | $0 | $0 | $0 | $0 |
| 2015 | -- | $0 | $0 | $0 |
| 2014 | -- | $0 | $0 | $0 |
| 2012 | -- | $7,800 | $0 | $0 |
Source: Public Records
Map
Nearby Homes
- 1651 N Chevrolet Ave
- 1645 Seminole St
- 2302 Mallery St
- 2001 Mackin Rd
- 2424 Begole St
- 1909 Proctor Ave
- 2509 Barth St
- 1717 Wolcott St
- 1315 Welch Blvd
- 2612 Concord St
- 2622 Concord St
- 1409 Prospect St
- 1606 Garland St
- 800 Martin Luther King Ave
- 506 Green St
- 1407 Greenway Ave
- 2410 Sloan St
- 1402 Lavender Ave
- 2602 Sloan St
- 1220 Forest Hill Ave
- 2001 Begole St
- 2009 Begole St
- 1917 Begole St
- 2006 Mallery St
- 2013 Begole St
- 2002 Mallery St
- 2010 Mallery St
- 1924 Mallery St
- 1913 Begole St
- 2017 Begole St
- 2014 Mallery St
- 2002 Begole St
- 2006 Begole St
- 1920 Mallery St
- 1916 Begole St
- 2010 Begole St
- 2018 Mallery St
- 1912 Begole St
- 2101 Begole St
- 1916 Mallery St
Your Personal Tour Guide
Ask me questions while you tour the home.