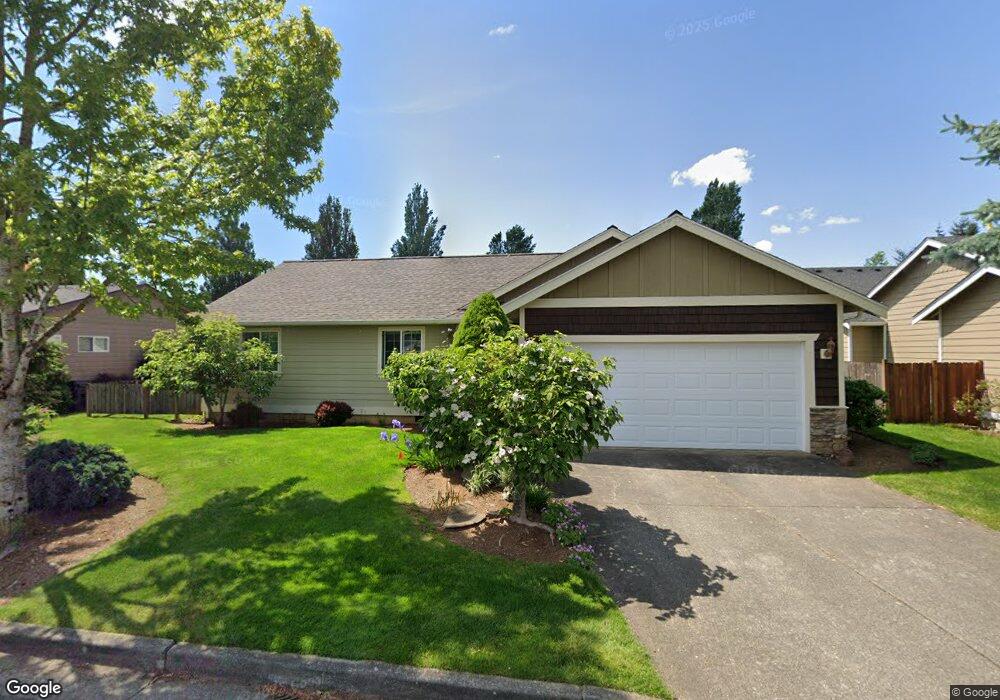
2005 Buttercup Dr Lynden, WA 98264
Estimated Value: $514,243 - $573,000
3
Beds
2
Baths
1,405
Sq Ft
$382/Sq Ft
Est. Value
About This Home
This home is located at 2005 Buttercup Dr, Lynden, WA 98264 and is currently estimated at $537,311, approximately $382 per square foot. 2005 Buttercup Dr is a home located in Whatcom County with nearby schools including Lynden High School, Lynden Christian Schools: Administration, and Lynden Christian School.
Ownership History
Date
Name
Owned For
Owner Type
Purchase Details
Closed on
Mar 24, 2009
Sold by
Marshall Terri A W and Marshall Keith W
Bought by
Huizenga Ray and Huizenga Glenda
Current Estimated Value
Purchase Details
Closed on
Sep 7, 2004
Sold by
Ellis Joe D and Ellis Joanne M
Bought by
Marshall Keith W and Marshall Terri A
Home Financials for this Owner
Home Financials are based on the most recent Mortgage that was taken out on this home.
Original Mortgage
$151,960
Interest Rate
6.06%
Mortgage Type
Purchase Money Mortgage
Purchase Details
Closed on
Apr 22, 2003
Sold by
Berry Richard
Bought by
Ellis Joe D and Ellis Joanne M
Purchase Details
Closed on
Aug 7, 2002
Sold by
Ruiter Martin
Bought by
Berry Richard
Home Financials for this Owner
Home Financials are based on the most recent Mortgage that was taken out on this home.
Original Mortgage
$106,250
Interest Rate
6.43%
Create a Home Valuation Report for This Property
The Home Valuation Report is an in-depth analysis detailing your home's value as well as a comparison with similar homes in the area
Home Values in the Area
Average Home Value in this Area
Purchase History
| Date | Buyer | Sale Price | Title Company |
|---|---|---|---|
| Huizenga Ray | $230,280 | Chicago Title Insurance | |
| Marshall Keith W | $189,950 | Whatcom Land Title | |
| Ellis Joe D | -- | First American Title Insuran | |
| Berry Richard | $35,000 | First American Title Insuran |
Source: Public Records
Mortgage History
| Date | Status | Borrower | Loan Amount |
|---|---|---|---|
| Previous Owner | Marshall Keith W | $151,960 | |
| Previous Owner | Berry Richard | $106,250 | |
| Closed | Marshall Keith W | $18,995 |
Source: Public Records
Tax History Compared to Growth
Tax History
| Year | Tax Paid | Tax Assessment Tax Assessment Total Assessment is a certain percentage of the fair market value that is determined by local assessors to be the total taxable value of land and additions on the property. | Land | Improvement |
|---|---|---|---|---|
| 2024 | $3,261 | $458,033 | $194,000 | $264,033 |
| 2023 | $3,261 | $453,878 | $200,000 | $253,878 |
| 2022 | $2,968 | $389,897 | $135,383 | $254,514 |
| 2021 | $2,911 | $322,224 | $111,885 | $210,339 |
| 2020 | $2,550 | $287,708 | $99,900 | $187,808 |
| 2019 | $2,269 | $263,882 | $91,725 | $172,157 |
| 2018 | $2,480 | $240,643 | $83,558 | $157,085 |
| 2017 | $2,210 | $215,997 | $75,000 | $140,997 |
| 2016 | $2,085 | $204,781 | $59,400 | $145,381 |
| 2015 | $1,848 | $192,143 | $57,132 | $135,011 |
| 2014 | -- | $185,633 | $55,188 | $130,445 |
| 2013 | -- | $184,445 | $54,000 | $130,445 |
Source: Public Records
Map
Nearby Homes
- 114 Twin Sister Loop
- 8844 Depot Rd Unit B204
- 8872 Depot Rd Unit 203
- 8780 Depot Rd Unit 207
- 8780 Depot Rd Unit 308
- 8780 Depot Rd Unit 309
- 9586 Bender Rd
- 300 Homestead Blvd Unit 104
- 424 Island Green Way
- 0 Island Green Way
- 8639 Bender Rd
- 107 Springview Dr
- 137 E Cedar Dr
- 1112 N Cascade Ct
- 1136 N Cascade Ct
- 2111 Greenview Ln
- 600 Sunrise Dr
- 1251 Garden Cir
- 2201 Dejong Dr
- 761 Sunrise Dr
- 2004 Bluebell Dr
- 2007 Buttercup Dr
- 2003 Buttercup Dr
- 2006 Bluebell Dr
- 2002 Bluebell Dr
- 2004 Buttercup Dr
- 2006 Buttercup Dr
- 2002 Buttercup Dr
- 2001 Buttercup Dr
- 2009 Buttercup Dr
- 2000 Bluebell Dr
- 500 Daisy Ln
- 2003 Heartland Dr
- 2001 Heartland Dr
- 524 Daisy Ln
- 2000 Buttercup Dr
- 2005 Heartland Dr
- 2007 Bluebell Dr
- 2005 Bluebell Dr
- 2009 Bluebell Dr