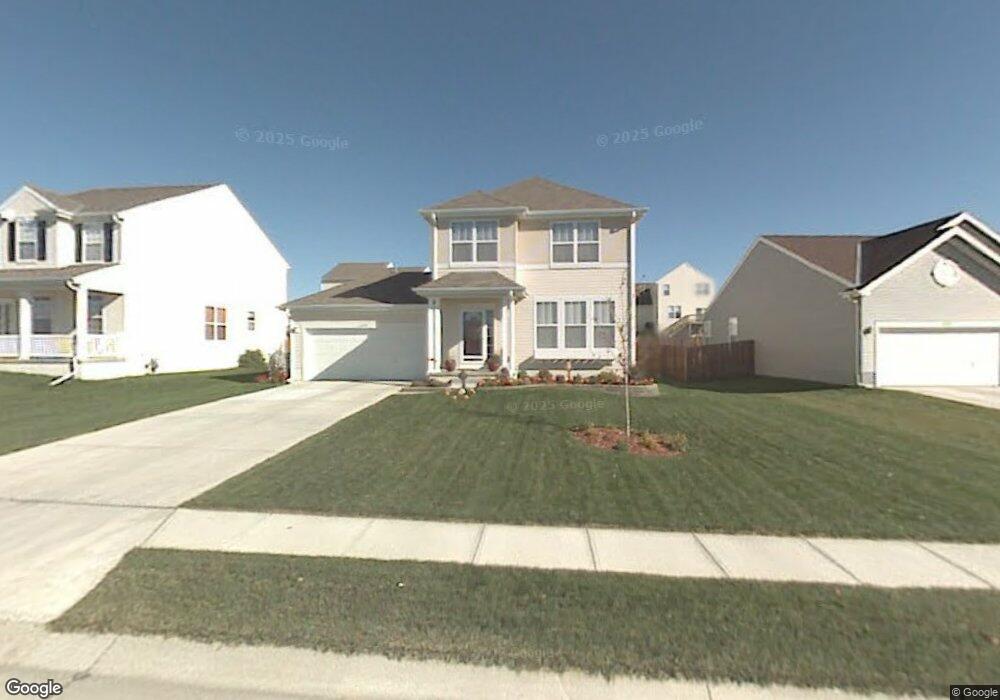
2005 Diane St Papillion, NE 68046
Estimated Value: $340,474 - $363,000
3
Beds
3
Baths
1,940
Sq Ft
$181/Sq Ft
Est. Value
About This Home
This home is located at 2005 Diane St, Papillion, NE 68046 and is currently estimated at $351,869, approximately $181 per square foot. 2005 Diane St is a home located in Sarpy County with nearby schools including Patriot Elementary School, Liberty Middle School, and Papillion La Vista South High School.
Create a Home Valuation Report for This Property
The Home Valuation Report is an in-depth analysis detailing your home's value as well as a comparison with similar homes in the area
Home Values in the Area
Average Home Value in this Area
Tax History Compared to Growth
Tax History
| Year | Tax Paid | Tax Assessment Tax Assessment Total Assessment is a certain percentage of the fair market value that is determined by local assessors to be the total taxable value of land and additions on the property. | Land | Improvement |
|---|---|---|---|---|
| 2025 | $4,678 | $276,930 | $54,000 | $222,930 |
| 2024 | $5,171 | $270,071 | $50,000 | $220,071 |
| 2023 | $5,171 | $247,478 | $47,000 | $200,478 |
| 2022 | $5,034 | $220,898 | $42,000 | $178,898 |
| 2021 | $4,737 | $202,561 | $39,000 | $163,561 |
| 2020 | $4,565 | $195,476 | $36,000 | $159,476 |
| 2019 | $4,372 | $189,194 | $34,000 | $155,194 |
| 2018 | $4,284 | $183,205 | $32,000 | $151,205 |
| 2017 | $4,145 | $177,443 | $32,000 | $145,443 |
| 2016 | $3,984 | $168,936 | $25,000 | $143,936 |
| 2015 | $3,985 | $163,641 | $25,000 | $138,641 |
| 2014 | $3,796 | $155,396 | $25,000 | $130,396 |
| 2012 | -- | $152,428 | $25,000 | $127,428 |
Source: Public Records
Map
Nearby Homes
- 2006 Diane St
- 2105 Petersen Dr
- 2221 Placid Lake Dr
- 2010 Ridgeview Dr
- 1806 Walnut Creek Dr
- 1808 Southview Dr
- 2110 S Mineral Dr
- 2231 Crystal Creek Dr
- 2070 Stillwater Dr
- 812 Lake Tahoe Dr
- 12001 S 90th St
- 814 Clearwater Dr
- 1704 Southview Dr
- 2404 Walnut Creek Dr
- 1104 Gold Coast Rd
- 2241 Glacier Dr
- 2421 Sand Hills Dr
- 501 Kent Dr
- 8904 Legacy St
- Lot 115 Ave Unit Lot 115
- 2007 Diane St
- 2003 Diane St
- 2009 Diane St
- 2006 Petersen Dr
- 2004 Petersen Dr
- 2008 Petersen Dr
- 2004 Diane St
- 2010 Petersen Dr
- 2008 Diane St
- 2101 Diane St
- 1110 Port Royal Dr
- 1112 Port Royal Dr
- 1108 Port Royal Dr
- 2010 Diane St
- 2102 Petersen Dr
- 1114 Port Royal Dr
- 1106 Port Royal Dr
- 2103 Diane St
- 2102 Diane St
- 1116 Port Royal Dr