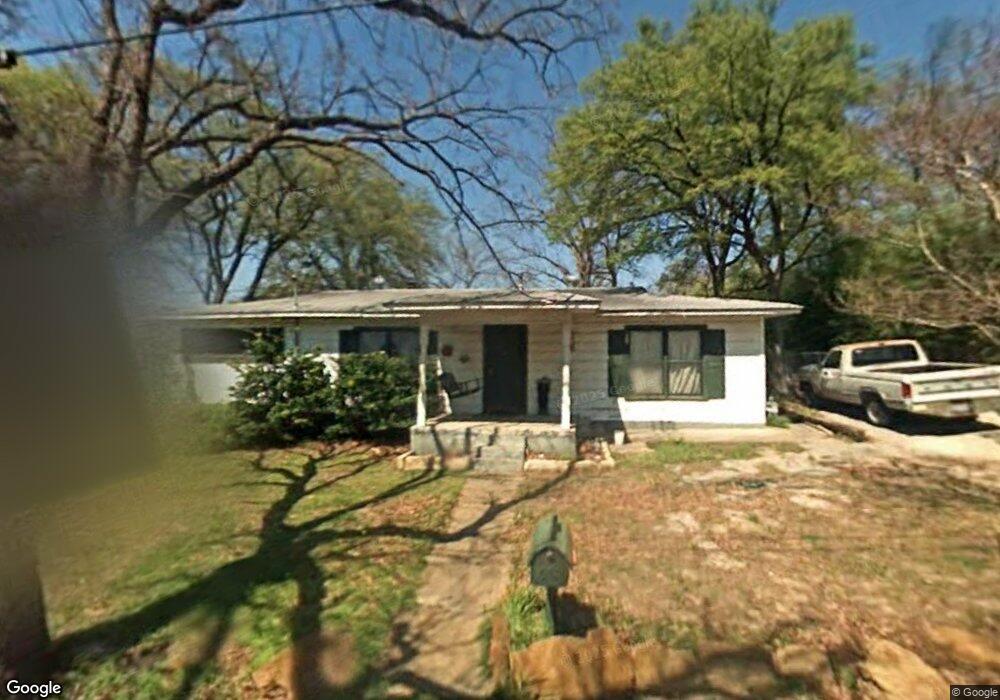
2005 Dove Ln Denison, TX 75020
Estimated Value: $171,000 - $177,939
3
Beds
2
Baths
1,893
Sq Ft
$92/Sq Ft
Est. Value
About This Home
This home is located at 2005 Dove Ln, Denison, TX 75020 and is currently estimated at $174,470, approximately $92 per square foot. 2005 Dove Ln is a home located in Grayson County with nearby schools including Mayes Elementary School, Scott Middle School, and Denison High School.
Ownership History
Date
Name
Owned For
Owner Type
Purchase Details
Closed on
Sep 7, 2010
Sold by
The Bank Of New York Mellon
Bought by
Pherigo Tim
Current Estimated Value
Purchase Details
Closed on
Mar 2, 2010
Sold by
Lewis Jonathan and Lewis Yvonne M
Bought by
The Bank Of New York Mellon and The Bank Of New York
Purchase Details
Closed on
Sep 26, 2005
Sold by
Citifinancial Mortgage Co Inc
Bought by
Lewis Jonathan and Lewis Yvonne
Home Financials for this Owner
Home Financials are based on the most recent Mortgage that was taken out on this home.
Original Mortgage
$52,155
Interest Rate
5.92%
Mortgage Type
Fannie Mae Freddie Mac
Purchase Details
Closed on
Jul 5, 2005
Sold by
Moreno Robbin E and Moreno Mario
Bought by
Citifinancial Mortgage Co Inc
Create a Home Valuation Report for This Property
The Home Valuation Report is an in-depth analysis detailing your home's value as well as a comparison with similar homes in the area
Home Values in the Area
Average Home Value in this Area
Purchase History
| Date | Buyer | Sale Price | Title Company |
|---|---|---|---|
| Pherigo Tim | -- | Red River Title Co | |
| The Bank Of New York Mellon | $36,000 | None Available | |
| Lewis Jonathan | -- | -- | |
| Citifinancial Mortgage Co Inc | $39,900 | -- |
Source: Public Records
Mortgage History
| Date | Status | Borrower | Loan Amount |
|---|---|---|---|
| Previous Owner | Lewis Jonathan | $52,155 |
Source: Public Records
Tax History
| Year | Tax Paid | Tax Assessment Tax Assessment Total Assessment is a certain percentage of the fair market value that is determined by local assessors to be the total taxable value of land and additions on the property. | Land | Improvement |
|---|---|---|---|---|
| 2025 | $2,323 | $101,352 | $81,976 | $19,376 |
| 2024 | $2,323 | $99,979 | $0 | $0 |
| 2023 | $1,888 | $83,316 | $65,381 | $17,935 |
| 2022 | $1,952 | $82,172 | $65,382 | $16,790 |
| 2021 | $1,226 | $48,629 | $34,590 | $14,039 |
| 2020 | $1,126 | $42,697 | $25,992 | $16,705 |
| 2019 | $1,452 | $52,752 | $25,992 | $26,760 |
| 2018 | $1,014 | $36,559 | $20,394 | $16,165 |
| 2017 | $824 | $29,458 | $14,196 | $15,262 |
| 2016 | $637 | $22,754 | $7,798 | $14,956 |
Source: Public Records
Map
Nearby Homes
- 1716 N Ridgewood Dr
- 2425 Juanita Dr
- 1140 Redbud St
- 1737 W Parnell St
- 1201 Ridgewood Rd
- 1728 W Washington St
- 816 Leeper Dr
- 2151 Juanita Dr
- 2021 W Walker St
- 1905 W Morton St Unit 5
- 1905 W Morton St Unit 20
- 1905 W Morton St Unit 6
- 1801 W Bond St
- 2112 W Bond St
- 1505 W Johnson St
- 501 W Walker St
- 909 W Walker St
- TBD W Johnson St
- 1523 W Bond St
- 2530 W Elm St
- 2011 Dove Ln
- 2019 Dove Ln
- 2015 Dove Ln
- 2741 Juanita Dr
- 2004 Dove Ln
- 2008 Dove Ln
- 2731 Juanita Dr
- 2721 Juanita Dr
- 2751 Juanita Dr
- 2517 Juanita Dr
- 2108 Dove Ln
- 1828 Meadowlark Ln
- 2511 Juanita Dr
- 1827 Mockingbird Ln
- 2110 Dove Ln
- 2801 Juanita Dr
- 1829 Meadowlark Ln
- 1824 Meadowlark Ln
- 1823 Mockingbird Ln
- 1825 Meadowlark Ln
Your Personal Tour Guide
Ask me questions while you tour the home.