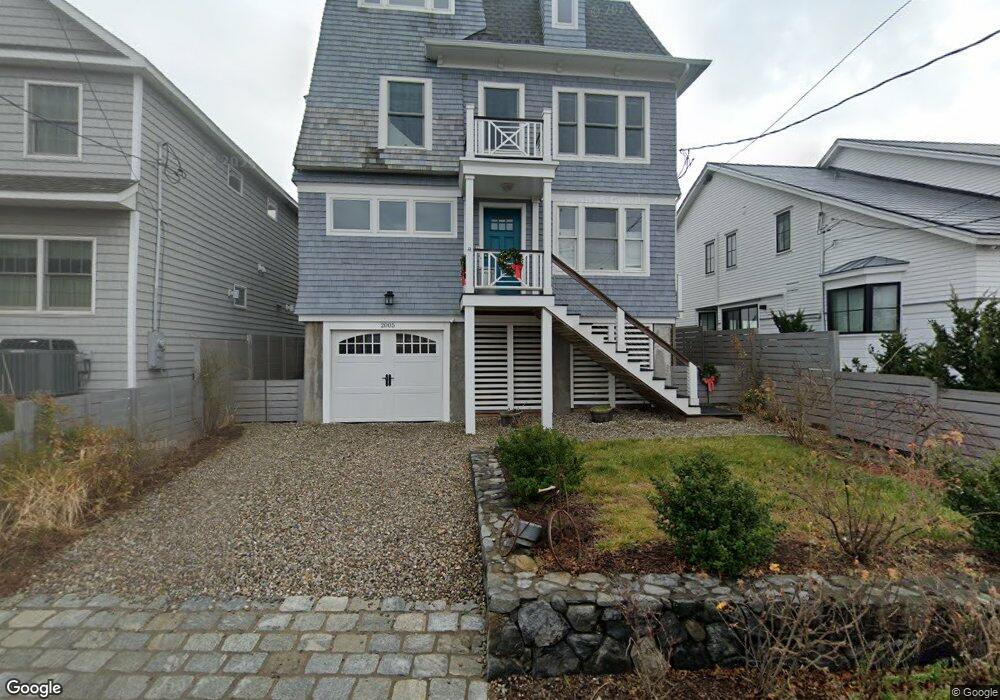
2005 Fairfield Beach Rd Fairfield, CT 06824
Fairfield Beach NeighborhoodEstimated Value: $2,352,672 - $3,325,000
3
Beds
7
Baths
2,810
Sq Ft
$953/Sq Ft
Est. Value
About This Home
This home is located at 2005 Fairfield Beach Rd, Fairfield, CT 06824 and is currently estimated at $2,678,918, approximately $953 per square foot. 2005 Fairfield Beach Rd is a home located in Fairfield County with nearby schools including Roger Sherman Elementary School, Roger Ludlowe Middle School, and Fairfield Ludlowe High School.
Ownership History
Date
Name
Owned For
Owner Type
Purchase Details
Closed on
Nov 18, 2021
Sold by
Bunnell Rebecca G
Bought by
Rebecca G Bunnell Irt and Bunnell
Current Estimated Value
Purchase Details
Closed on
Apr 29, 2013
Sold by
Bunnell Douglas
Bought by
Bunnell Rebecca
Purchase Details
Closed on
Jan 3, 2011
Sold by
Schaffer John N
Bought by
Bunnell Douglas W and Bunnell Rebecca G
Purchase Details
Closed on
Aug 31, 2006
Sold by
Schiavone Deborah J
Bought by
Schaffer John N
Purchase Details
Closed on
Sep 10, 2001
Sold by
Soderlund Karl E and Soderlund Marissa S
Bought by
Schaffer John N
Purchase Details
Closed on
Oct 1, 1997
Sold by
Herron Betty A
Bought by
Soderlund Karl E and Soderlund Marisa S
Purchase Details
Closed on
Sep 1, 1994
Sold by
Lituack Sanford M and Lituack Judith E
Bought by
Herron Betty A
Create a Home Valuation Report for This Property
The Home Valuation Report is an in-depth analysis detailing your home's value as well as a comparison with similar homes in the area
Home Values in the Area
Average Home Value in this Area
Purchase History
| Date | Buyer | Sale Price | Title Company |
|---|---|---|---|
| Rebecca G Bunnell Irt | -- | None Available | |
| Rebecca G Bunnell Irt | -- | None Available | |
| Bunnell Rebecca | -- | -- | |
| Bunnell Douglas W | $1,692,850 | -- | |
| Schaffer John N | $450,000 | -- | |
| Schaffer John N | $1,195,000 | -- | |
| Soderlund Karl E | $617,500 | -- | |
| Herron Betty A | $600,000 | -- | |
| Bunnell Rebecca | -- | -- | |
| Bunnell Douglas W | $1,692,850 | -- | |
| Schaffer John N | $450,000 | -- | |
| Schaffer John N | $1,195,000 | -- | |
| Soderlund Karl E | $617,500 | -- | |
| Herron Betty A | $600,000 | -- |
Source: Public Records
Mortgage History
| Date | Status | Borrower | Loan Amount |
|---|---|---|---|
| Previous Owner | Herron Betty A | $500,000 |
Source: Public Records
Tax History Compared to Growth
Tax History
| Year | Tax Paid | Tax Assessment Tax Assessment Total Assessment is a certain percentage of the fair market value that is determined by local assessors to be the total taxable value of land and additions on the property. | Land | Improvement |
|---|---|---|---|---|
| 2025 | $31,670 | $1,115,520 | $772,170 | $343,350 |
| 2024 | $31,123 | $1,115,520 | $772,170 | $343,350 |
| 2023 | $30,688 | $1,115,520 | $772,170 | $343,350 |
| 2022 | $30,387 | $1,115,520 | $772,170 | $343,350 |
| 2021 | $30,554 | $1,132,460 | $772,170 | $360,290 |
| 2020 | $27,430 | $1,023,890 | $645,890 | $378,000 |
| 2019 | $27,430 | $1,023,890 | $645,890 | $378,000 |
| 2018 | $26,990 | $1,023,890 | $645,890 | $378,000 |
| 2017 | $22,108 | $856,240 | $645,890 | $210,350 |
| 2016 | $21,791 | $856,240 | $645,890 | $210,350 |
| 2015 | $27,735 | $1,118,810 | $998,270 | $120,540 |
| 2014 | $27,299 | $1,118,810 | $998,270 | $120,540 |
Source: Public Records
Map
Nearby Homes
- 2117 Fairfield Beach Rd
- 2142 Fairfield Beach Rd
- 1410 S Pine Creek Rd
- 97 Field Point Dr
- 972 S Pine Creek Rd
- 1235 Fairfield Beach Rd
- 1131 Sasco Hill Rd
- 154 Gorham Rd
- 775 Sasco Hill Rd
- 828 Sasco Hill Rd
- 1008 Fairfield Beach Rd
- 2 Mellow St
- 6 Lighthouse Point
- 783 Reef Rd
- 127 Paul Place
- 196 Catherine Terrace
- 85 Patrick Dr
- 465 Edward St
- 35 Millard St
- 137 Millard St
- 1999 Fairfield Beach Rd
- 1995 Fairfield Beach Rd
- 2015 Fairfield Beach Rd
- 1987 Fairfield Beach Rd
- 2016 Fairfield Beach Rd
- 2029 Fairfield Beach Rd
- 1979 Fairfield Beach Rd
- 1979 Fairfield Beach Rd Unit RNTL
- 2124 Fairfield Beach Rd
- 2041 Fairfield Beach Rd
- 1973 Fairfield Beach Rd
- 2030 Fairfield Beach Rd
- 1965 Fairfield Beach Rd
- 2059 Fairfield Beach Rd
- 2060 Fairfield Beach Rd
- 1957 Fairfield Beach Rd
- 2070 Fairfield Beach Rd
- 2063 Fairfield Beach Rd
- 2144 Fairfield Beach Rd
- 1949 Fairfield Beach Rd