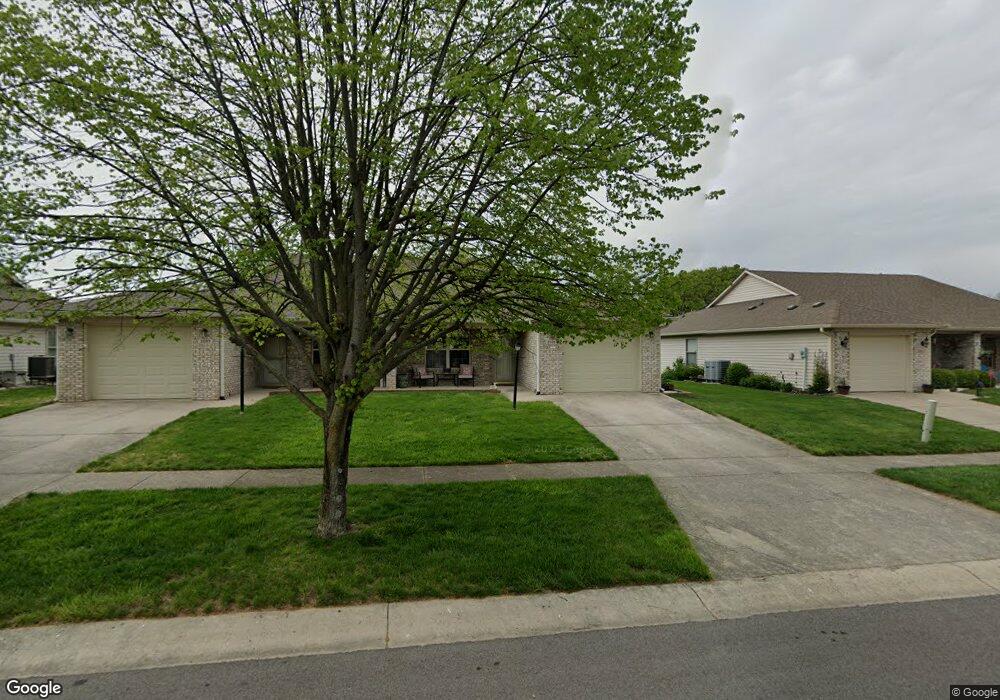
2005 Flamingo Way Franklin, IN 46131
Estimated Value: $204,685 - $215,000
2
Beds
1
Bath
1,049
Sq Ft
$200/Sq Ft
Est. Value
About This Home
This home is located at 2005 Flamingo Way, Franklin, IN 46131 and is currently estimated at $209,421, approximately $199 per square foot. 2005 Flamingo Way is a home located in Johnson County with nearby schools including Northwood Elementary School, Franklin Community Middle School, and Custer Baker Intermediate School.
Ownership History
Date
Name
Owned For
Owner Type
Purchase Details
Closed on
Jun 8, 2017
Sold by
Bell John Allen
Bought by
Sprague Virginia
Current Estimated Value
Home Financials for this Owner
Home Financials are based on the most recent Mortgage that was taken out on this home.
Original Mortgage
$100,000
Outstanding Balance
$83,048
Interest Rate
4.05%
Mortgage Type
New Conventional
Estimated Equity
$126,373
Purchase Details
Closed on
Jun 6, 2014
Sold by
Rams Llc
Bought by
Bell John Allen
Home Financials for this Owner
Home Financials are based on the most recent Mortgage that was taken out on this home.
Original Mortgage
$7,680
Interest Rate
4.18%
Mortgage Type
Purchase Money Mortgage
Purchase Details
Closed on
May 15, 2014
Sold by
Hey Dorothy G
Bought by
Rams Llc
Home Financials for this Owner
Home Financials are based on the most recent Mortgage that was taken out on this home.
Original Mortgage
$7,680
Interest Rate
4.18%
Mortgage Type
Purchase Money Mortgage
Create a Home Valuation Report for This Property
The Home Valuation Report is an in-depth analysis detailing your home's value as well as a comparison with similar homes in the area
Home Values in the Area
Average Home Value in this Area
Purchase History
| Date | Buyer | Sale Price | Title Company |
|---|---|---|---|
| Sprague Virginia | -- | None Available | |
| Bell John Allen | -- | Chicago Title Company Llc | |
| Rams Llc | $53,000 | None Available |
Source: Public Records
Mortgage History
| Date | Status | Borrower | Loan Amount |
|---|---|---|---|
| Open | Sprague Virginia | $100,000 | |
| Previous Owner | Bell John Allen | $7,680 | |
| Previous Owner | Rams Llc | $60,000 |
Source: Public Records
Tax History Compared to Growth
Tax History
| Year | Tax Paid | Tax Assessment Tax Assessment Total Assessment is a certain percentage of the fair market value that is determined by local assessors to be the total taxable value of land and additions on the property. | Land | Improvement |
|---|---|---|---|---|
| 2025 | $669 | $200,500 | $40,000 | $160,500 |
| 2024 | $669 | $170,100 | $32,500 | $137,600 |
| 2023 | $656 | $153,000 | $32,500 | $120,500 |
| 2022 | $643 | $146,000 | $32,500 | $113,500 |
| 2021 | $631 | $124,400 | $28,300 | $96,100 |
| 2020 | $618 | $117,900 | $15,600 | $102,300 |
| 2019 | $606 | $112,200 | $7,000 | $105,200 |
| 2018 | $598 | $105,600 | $7,000 | $98,600 |
| 2017 | $593 | $96,400 | $7,000 | $89,400 |
| 2016 | $600 | $85,300 | $7,000 | $78,300 |
| 2014 | $756 | $82,200 | $15,900 | $66,300 |
| 2013 | $756 | $85,200 | $15,900 | $69,300 |
Source: Public Records
Map
Nearby Homes
- 2090 Pelican Dr
- 2084 Pelican Dr
- 1338 Swan Dr
- 2146 Charles Dr
- 1213 Greenbriar Way
- 1283 Crabapple Rd
- 492 Pelenor Dr
- 1343 Crabapple Rd
- 1397 Greenbriar Way
- 990 Canary Creek Dr
- 1278 Northcraft Ct
- Norway Plan at Westwind at Cumberland
- Bradford Plan at Westwind at Cumberland
- Juniper Plan at Westwind at Cumberland
- Aspen II Plan at Westwind at Cumberland
- Empress Plan at Westwind at Cumberland
- Cooper Plan at Westwind at Cumberland
- Spruce Plan at Westwind at Cumberland
- Palmetto Plan at Westwind at Cumberland
- Ironwood Plan at Westwind at Cumberland
- 2003 Flamingo Way
- 2007 Flamingo Way
- 2009 Flamingo Way
- 1999 Flamingo Way
- 2013 Flamingo Way
- 2013 Flamingo Way Unit PT
- 1997 Flamingo Way
- 2004 Flamingo Way
- 2006 Flamingo Way
- 2023 Flamingo Way
- 2002 Flamingo Way
- 2033 Flamingo Way
- 2010 Flamingo Way
- 2093 Pelican Dr
- 2093 Pelican Dr Unit West
- 2035 Flamingo Way
- 2012 Flamingo Way
- 2037 Flamingo Way
- 2085 Pelican Dr
- 2057 Pelican Dr