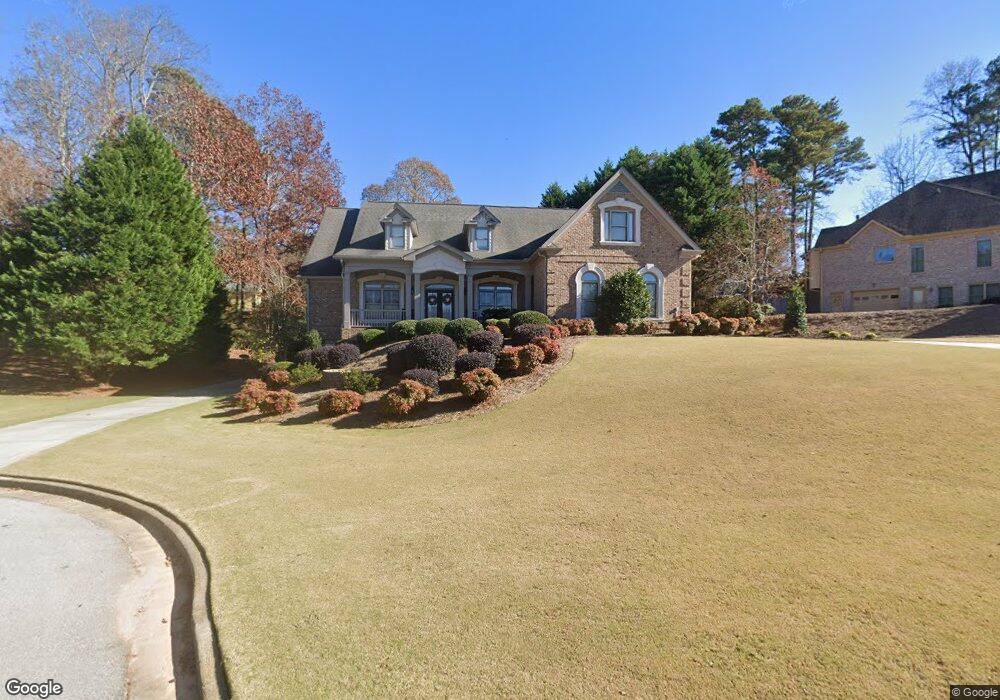
2005 Harbor Ridge Ct Unit 2005 Buford, GA 30518
Estimated Value: $686,473 - $1,113,000
4
Beds
5
Baths
3,072
Sq Ft
$282/Sq Ft
Est. Value
About This Home
This home is located at 2005 Harbor Ridge Ct Unit 2005, Buford, GA 30518 and is currently estimated at $865,368, approximately $281 per square foot. 2005 Harbor Ridge Ct Unit 2005 is a home located in Gwinnett County with nearby schools including Buford Elementary School, Buford Academy, and Buford Senior Academy.
Ownership History
Date
Name
Owned For
Owner Type
Purchase Details
Closed on
Jun 18, 2021
Sold by
Botchey Faith A
Bought by
Botchey Faith A and Botchey Festus Gifford
Current Estimated Value
Home Financials for this Owner
Home Financials are based on the most recent Mortgage that was taken out on this home.
Original Mortgage
$512,000
Outstanding Balance
$378,130
Interest Rate
2.9%
Mortgage Type
New Conventional
Estimated Equity
$487,238
Purchase Details
Closed on
Oct 13, 2011
Sold by
Rider Bobby
Bought by
Hadden David C and Hadden Donna W
Purchase Details
Closed on
Aug 29, 2005
Sold by
Hazan Edward R and Hazan Lisa
Bought by
Rider Bobby and Rider Jeannine
Home Financials for this Owner
Home Financials are based on the most recent Mortgage that was taken out on this home.
Original Mortgage
$356,000
Interest Rate
1%
Mortgage Type
New Conventional
Purchase Details
Closed on
Jul 20, 2004
Sold by
Pyramid Dev Inc
Bought by
Hazan Edward R and Hazan Lisa
Create a Home Valuation Report for This Property
The Home Valuation Report is an in-depth analysis detailing your home's value as well as a comparison with similar homes in the area
Home Values in the Area
Average Home Value in this Area
Purchase History
| Date | Buyer | Sale Price | Title Company |
|---|---|---|---|
| Botchey Faith A | -- | -- | |
| Botchey Faith A | $539,900 | -- | |
| Hadden David C | $330,000 | -- | |
| Rider Bobby | $445,000 | -- | |
| Hazan Edward R | $425,000 | -- |
Source: Public Records
Mortgage History
| Date | Status | Borrower | Loan Amount |
|---|---|---|---|
| Open | Botchey Faith A | $512,000 | |
| Closed | Botchey Faith A | $512,000 | |
| Previous Owner | Rider Bobby | $356,000 |
Source: Public Records
Tax History Compared to Growth
Tax History
| Year | Tax Paid | Tax Assessment Tax Assessment Total Assessment is a certain percentage of the fair market value that is determined by local assessors to be the total taxable value of land and additions on the property. | Land | Improvement |
|---|---|---|---|---|
| 2025 | $2,478 | $351,200 | $44,000 | $307,200 |
| 2024 | $2,478 | $215,960 | $31,600 | $184,360 |
| 2023 | $2,478 | $215,960 | $31,600 | $184,360 |
| 2022 | $2,478 | $215,960 | $31,600 | $184,360 |
| 2021 | $2,750 | $183,920 | $31,600 | $152,320 |
| 2020 | $2,750 | $183,920 | $31,600 | $152,320 |
| 2019 | $2,321 | $171,400 | $31,600 | $139,800 |
| 2018 | $2,080 | $152,800 | $28,000 | $124,800 |
| 2016 | $1,810 | $133,400 | $28,000 | $105,400 |
| 2015 | $1,861 | $133,400 | $28,000 | $105,400 |
| 2014 | -- | $133,400 | $28,000 | $105,400 |
Source: Public Records
Map
Nearby Homes
- 2015 Buford Dam Rd
- 2030 Buford Dam Rd
- 1930 Marina Way
- 2075 Pine Tree Dr Unit B2
- 2075 Pine Tree Dr Unit A3
- 5820 Elm Tree Dr Unit 1
- 6205 Ambercrest Ct
- 5984 Dolvin Ln
- 5871 Dolvin Ln
- 5774 Harbor Dr
- 1983 Anchor Way Unit 1
- 6265 Lake Windsor Pkwy
- 6219 Woodlake Dr
- 6255 Lakeview Dr
- 1920 Patrick Mill Place
- 5995 Lake Windsor Pkwy Unit 1
- 5600 Creek Dale Way
- 5601 Creek Dale Way
- 2243 Bedstone Dr Unit 2
- 1770 Patrick Mill Place
- 2005 Harbor Ridge Ct Unit .
- 2005 Harbor Ridge Ct
- 1990 Marina Way
- 2015 Harbor Ridge Ct
- 2027 Buford Dam Rd
- 2023 Buford Dam Rd
- 2037 Buford Dam Rd
- 1965 Marina Way
- 1950 Marina Way
- 2019 Buford Dam Rd
- 2020 Marina Way
- 1985 Marina Way Unit 25
- 1985 Marina Way
- 1955 Marina Way
- 2005 Marina Way
- 1940 Marina Way
- 2015 Marina Way
- 2034 Buford Dam Rd
- 2026 Buford Dam Rd
- 2009 Buford Dam Rd