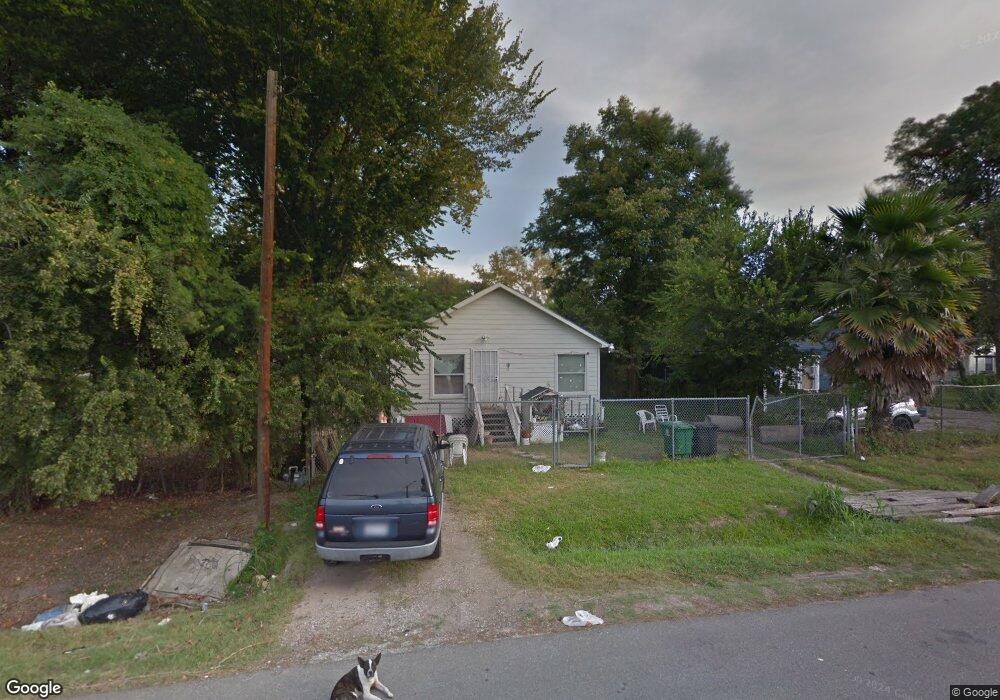
2005 Linder St Houston, TX 77026
Eastex-Jensen NeighborhoodEstimated Value: $130,000 - $168,000
2
Beds
1
Bath
728
Sq Ft
$204/Sq Ft
Est. Value
About This Home
This home is located at 2005 Linder St, Houston, TX 77026 and is currently estimated at $148,753, approximately $204 per square foot. 2005 Linder St is a home located in Harris County with nearby schools including Ross Elementary School, Key Middle, and Northside High School.
Ownership History
Date
Name
Owned For
Owner Type
Purchase Details
Closed on
Mar 22, 2002
Sold by
Howell Evan S
Bought by
Beltran Irma
Current Estimated Value
Home Financials for this Owner
Home Financials are based on the most recent Mortgage that was taken out on this home.
Original Mortgage
$15,000
Interest Rate
6.83%
Mortgage Type
Seller Take Back
Purchase Details
Closed on
Jan 15, 2001
Sold by
Pena Vivian A
Bought by
Howell Evan S
Create a Home Valuation Report for This Property
The Home Valuation Report is an in-depth analysis detailing your home's value as well as a comparison with similar homes in the area
Home Values in the Area
Average Home Value in this Area
Purchase History
| Date | Buyer | Sale Price | Title Company |
|---|---|---|---|
| Beltran Irma | -- | -- | |
| Howell Evan S | -- | -- |
Source: Public Records
Mortgage History
| Date | Status | Borrower | Loan Amount |
|---|---|---|---|
| Closed | Beltran Irma | $15,000 |
Source: Public Records
Tax History Compared to Growth
Tax History
| Year | Tax Paid | Tax Assessment Tax Assessment Total Assessment is a certain percentage of the fair market value that is determined by local assessors to be the total taxable value of land and additions on the property. | Land | Improvement |
|---|---|---|---|---|
| 2025 | $2,441 | $108,556 | $56,196 | $52,360 |
| 2024 | $2,441 | $116,658 | $61,678 | $54,980 |
| 2023 | $2,441 | $114,301 | $61,678 | $52,623 |
| 2022 | $1,996 | $90,639 | $41,119 | $49,520 |
| 2021 | $1,824 | $78,243 | $41,119 | $37,124 |
| 2020 | $1,490 | $61,529 | $21,930 | $39,599 |
| 2019 | $1,557 | $61,529 | $21,930 | $39,599 |
| 2018 | $902 | $35,647 | $12,336 | $23,311 |
| 2017 | $901 | $35,647 | $12,336 | $23,311 |
| 2016 | $901 | $35,647 | $12,336 | $23,311 |
| 2015 | $836 | $32,538 | $10,965 | $21,573 |
| 2014 | $836 | $32,538 | $10,965 | $21,573 |
Source: Public Records
Map
Nearby Homes