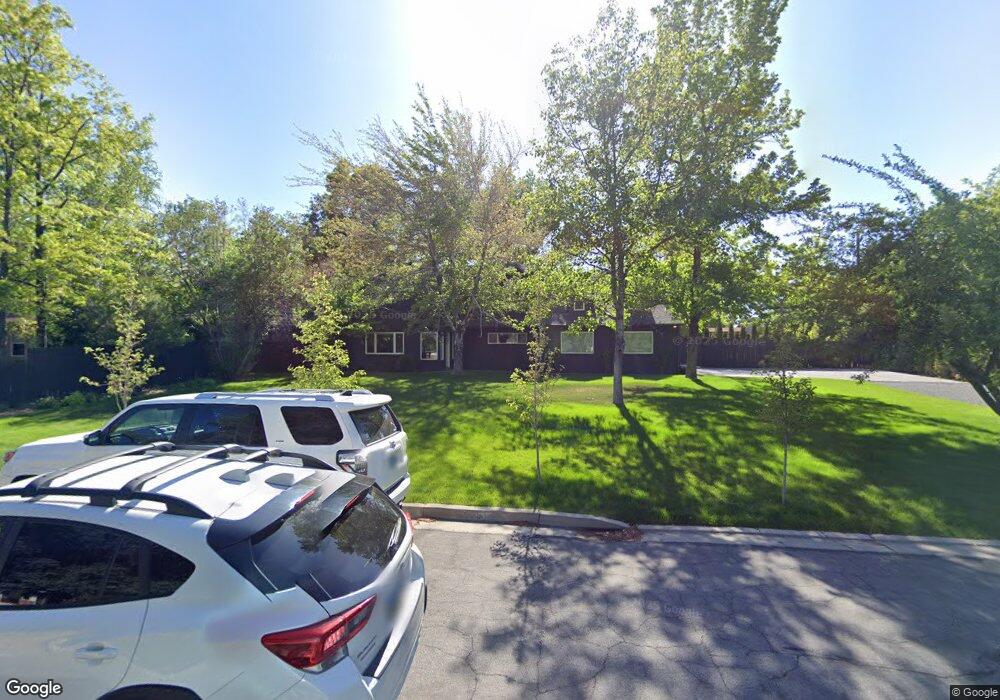
2005 Marsh Ave Unit Ave Reno, NV 89509
Skyline Boulevard NeighborhoodEstimated Value: $962,000 - $1,126,000
3
Beds
2
Baths
2,284
Sq Ft
$452/Sq Ft
Est. Value
About This Home
This home is located at 2005 Marsh Ave Unit Ave, Reno, NV 89509 and is currently estimated at $1,032,212, approximately $451 per square foot. 2005 Marsh Ave Unit Ave is a home located in Washoe County with nearby schools including Jessie Beck Elementary School, Darrell C Swope Middle School, and Reno High School.
Ownership History
Date
Name
Owned For
Owner Type
Purchase Details
Closed on
Jul 1, 2024
Sold by
Rohrmeier Christopher
Bought by
Bennett Peter A and Bennett Stefanie
Current Estimated Value
Home Financials for this Owner
Home Financials are based on the most recent Mortgage that was taken out on this home.
Original Mortgage
$766,550
Outstanding Balance
$755,334
Interest Rate
6.99%
Mortgage Type
New Conventional
Estimated Equity
$276,878
Purchase Details
Closed on
Jun 29, 2021
Sold by
Rohrmeier Kerry
Bought by
Rohrmeier Christopher
Home Financials for this Owner
Home Financials are based on the most recent Mortgage that was taken out on this home.
Original Mortgage
$680,000
Interest Rate
2.9%
Mortgage Type
New Conventional
Purchase Details
Closed on
Jun 7, 2021
Sold by
Soderlund Matthew B and Soderlund Jennifer A
Bought by
Rohrmeier Christopher
Home Financials for this Owner
Home Financials are based on the most recent Mortgage that was taken out on this home.
Original Mortgage
$680,000
Interest Rate
2.9%
Mortgage Type
New Conventional
Purchase Details
Closed on
Oct 18, 2019
Sold by
Black David A
Bought by
Soderlund Matthew B and Soderlund Jennifer A
Home Financials for this Owner
Home Financials are based on the most recent Mortgage that was taken out on this home.
Original Mortgage
$444,000
Interest Rate
3.4%
Mortgage Type
New Conventional
Purchase Details
Closed on
Dec 19, 2013
Sold by
Dory Terrill R and Dory Terrie
Bought by
Dory Terrill R and Dory Terrie
Purchase Details
Closed on
May 10, 2011
Sold by
Black Peggie A
Bought by
Black David A
Purchase Details
Closed on
Jul 10, 2007
Sold by
Black Peggie A and Black David A
Bought by
Black David A and Black Peggie A
Home Financials for this Owner
Home Financials are based on the most recent Mortgage that was taken out on this home.
Original Mortgage
$413,000
Interest Rate
6.41%
Mortgage Type
New Conventional
Purchase Details
Closed on
Feb 17, 2004
Sold by
Dory Terrill R and Dory Terrie
Bought by
Black David A and Black Peggie A
Home Financials for this Owner
Home Financials are based on the most recent Mortgage that was taken out on this home.
Original Mortgage
$310,000
Interest Rate
2.87%
Mortgage Type
Unknown
Purchase Details
Closed on
Nov 20, 2003
Sold by
Dory Terrill R and Dory Terrie
Bought by
Dory Terrill R and Dory Terrie
Create a Home Valuation Report for This Property
The Home Valuation Report is an in-depth analysis detailing your home's value as well as a comparison with similar homes in the area
Home Values in the Area
Average Home Value in this Area
Purchase History
| Date | Buyer | Sale Price | Title Company |
|---|---|---|---|
| Bennett Peter A | $1,150,000 | Core Title | |
| Rohrmeier Christopher | $850,000 | First Centennial Title | |
| Rohrmeier Christopher | $850,000 | First Centennial Title | |
| Soderlund Matthew B | $555,000 | First Centennial Reno | |
| Dory Terrill R | -- | None Available | |
| Black David A | -- | None Available | |
| Black David A | -- | First American Title | |
| Black David A | $387,500 | Western Title Incorporated | |
| Dory Terrill R | -- | -- |
Source: Public Records
Mortgage History
| Date | Status | Borrower | Loan Amount |
|---|---|---|---|
| Open | Bennett Peter A | $766,550 | |
| Previous Owner | Rohrmeier Christopher | $680,000 | |
| Previous Owner | Soderlund Matthew B | $444,000 | |
| Previous Owner | Black David A | $413,000 | |
| Previous Owner | Black David A | $310,000 | |
| Closed | Black David A | $58,100 |
Source: Public Records
Tax History
| Year | Tax Paid | Tax Assessment Tax Assessment Total Assessment is a certain percentage of the fair market value that is determined by local assessors to be the total taxable value of land and additions on the property. | Land | Improvement |
|---|---|---|---|---|
| 2026 | $2,185 | $109,991 | $56,963 | $53,029 |
| 2025 | $2,711 | $108,005 | $56,411 | $51,594 |
| 2024 | $2,711 | $107,117 | $54,243 | $52,874 |
| 2023 | $2,633 | $107,715 | $56,963 | $50,752 |
| 2022 | $2,559 | $90,033 | $47,334 | $42,699 |
| 2021 | $2,485 | $83,365 | $40,425 | $42,940 |
| 2020 | $1,831 | $66,602 | $40,425 | $26,177 |
| 2019 | $1,780 | $62,875 | $36,750 | $26,125 |
| 2018 | $1,726 | $57,145 | $30,800 | $26,345 |
| 2017 | $1,676 | $55,978 | $28,875 | $27,103 |
| 2016 | $1,634 | $55,292 | $26,950 | $28,342 |
| 2015 | $1,635 | $47,709 | $16,709 | $31,000 |
| 2014 | $1,589 | $46,125 | $15,593 | $30,532 |
| 2013 | -- | $41,671 | $11,396 | $30,275 |
Source: Public Records
Map
Nearby Homes
- 2100 Marsh Ave
- 2135 Marsh Ave
- 1165 Harvey Ln
- 1520 Westwood Dr
- 1555 S Marsh Ave
- 2201 Barnes Blvd
- 2350 Barnes Cir
- 2390 Barnes Cir
- 2170 Hunter Lake Dr
- 2303 Queen Anne Ct
- 1400 Belford Rd
- 995 Skyline Blvd
- 1355 Charles Dr
- 2195 W Plumb Ln
- 150 Mayberry Dr
- 2425 Foley Way
- 1464 Mark Twain Ave
- 144 Greenridge Dr
- 255 Circle Dr
- 1281 Skyline Blvd
- 2005 Marsh Ave
- 2065 Marsh Ave
- 1975 Marsh Ave
- 2000 Pineridge Dr
- 2075 Marsh Ave
- 1945 Marsh Ave
- 2000 Marsh Ave
- 2050 Pineridge Dr
- 1970 Pineridge Dr
- 2070 Marsh Ave
- 1970 Marsh Ave
- 2080 Pineridge Dr
- 2095 Marsh Ave
- 1360 W Plumb Ln
- 1901 Marsh Ave
- 1290 W Plumb Ln
- 1995 Fallen Leaf Ct
- 1975 Fallen Leaf Ct
- 1900 Pineridge Dr
- 2080 Marsh Ave
Your Personal Tour Guide
Ask me questions while you tour the home.