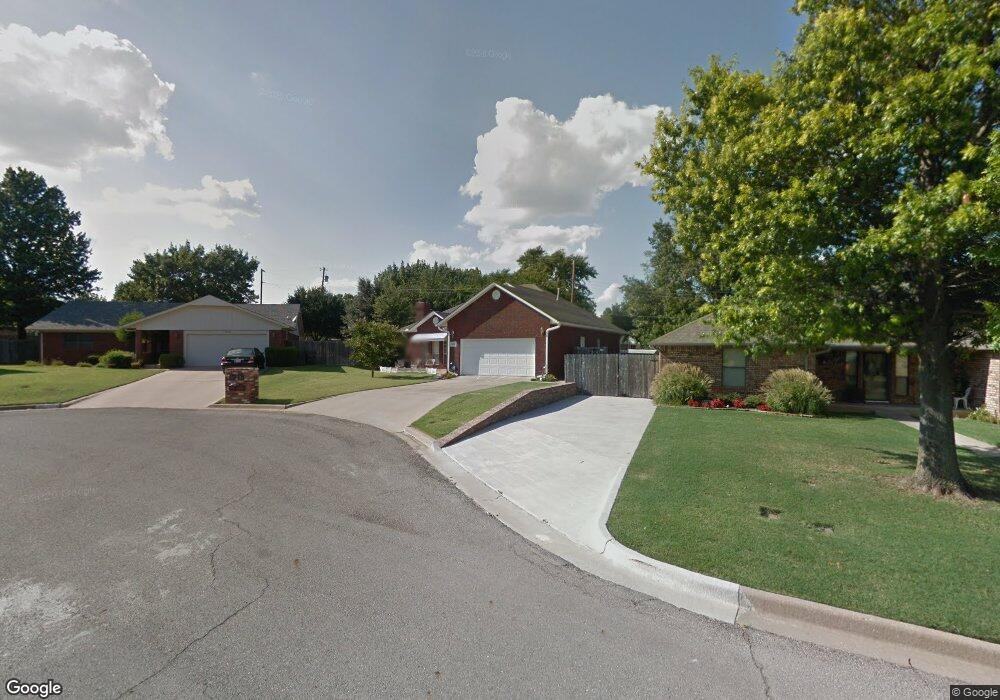
2005 Marsh Ln Ardmore, OK 73401
Estimated Value: $234,798 - $265,000
3
Beds
2
Baths
1,695
Sq Ft
$147/Sq Ft
Est. Value
About This Home
This home is located at 2005 Marsh Ln, Ardmore, OK 73401 and is currently estimated at $249,950, approximately $147 per square foot. 2005 Marsh Ln is a home located in Carter County with nearby schools including Lincoln Elementary School, Ardmore Middle School, and Ardmore High School.
Ownership History
Date
Name
Owned For
Owner Type
Purchase Details
Closed on
Feb 19, 2008
Sold by
Crump Jean
Bought by
Berryhill Thomas J and Berryhill Donna J
Current Estimated Value
Home Financials for this Owner
Home Financials are based on the most recent Mortgage that was taken out on this home.
Original Mortgage
$85,000
Outstanding Balance
$52,622
Interest Rate
5.88%
Mortgage Type
New Conventional
Estimated Equity
$197,328
Purchase Details
Closed on
Apr 27, 2005
Sold by
Green Carl Ray and Green Cheryl Ann
Bought by
Crump Jean
Purchase Details
Closed on
Feb 29, 2000
Sold by
Burke Robert and Burke Bobby
Bought by
Green Carl Ray and Green Chery
Purchase Details
Closed on
Dec 12, 1997
Sold by
Love Tom L
Bought by
Burke Robert and Burke Bobby
Create a Home Valuation Report for This Property
The Home Valuation Report is an in-depth analysis detailing your home's value as well as a comparison with similar homes in the area
Purchase History
| Date | Buyer | Sale Price | Title Company |
|---|---|---|---|
| Berryhill Thomas J | $160,000 | -- | |
| Crump Jean | $137,000 | -- | |
| Green Carl Ray | $106,000 | -- | |
| Burke Robert | $99,500 | -- |
Source: Public Records
Mortgage History
| Date | Status | Borrower | Loan Amount |
|---|---|---|---|
| Open | Berryhill Thomas J | $85,000 |
Source: Public Records
Tax History
| Year | Tax Paid | Tax Assessment Tax Assessment Total Assessment is a certain percentage of the fair market value that is determined by local assessors to be the total taxable value of land and additions on the property. | Land | Improvement |
|---|---|---|---|---|
| 2025 | -- | $25,291 | $2,400 | $22,891 |
| 2024 | -- | $24,555 | $2,400 | $22,155 |
| 2023 | $0 | $23,839 | $2,400 | $21,439 |
| 2022 | $0 | $23,145 | $2,400 | $20,745 |
| 2021 | $0 | $22,471 | $2,400 | $20,071 |
| 2020 | $0 | $22,036 | $1,499 | $20,537 |
| 2019 | $2,169 | $22,342 | $1,499 | $20,843 |
| 2018 | $0 | $22,078 | $1,499 | $20,579 |
| 2017 | $0 | $21,026 | $1,499 | $19,527 |
| 2016 | $1,544 | $20,025 | $1,499 | $18,526 |
| 2015 | $1,544 | $20,103 | $1,499 | $18,604 |
| 2014 | $1,563 | $20,342 | $1,499 | $18,843 |
Source: Public Records
Map
Nearby Homes
- 1111 Surrey Dr
- 1834 Sunset Park Terrace
- 1223 Buckingham
- 1310 Buckingham
- 1319 Brookhaven St
- 1200 Holly St
- 1702 Olive St
- 1508 Sunny Ln
- 1507 Sunny Ln
- 2200 Cloverleaf Place
- 1602 Rosedale St
- 2222 Cloverleaf Place
- 1501 Rosedale St
- 1413 Sunny Ln
- 1001 Rockford Ct
- 1404 Oak Ridge Rd
- 1006 S Rockford Rd
- 1407 Windsor Dr
- 811 Rosewood St
- 725 Marlena Ln
- 2001 Marsh Ln
- 2009 Marsh Ln
- 1916 Harmony Dr
- 1920 Harmony Dr
- 1917 Marsh Ln
- 2014 Marsh Ln
- 2002 Marsh Ln
- 1912 Harmony Dr
- 2010 Marsh Ln
- 1913 Marsh Ln
- 1918 Marsh Ln
- 2001 Jamestown Ct
- 1908 Harmony Dr
- 1111 Harmony Dr
- 1914 Marsh Ln
- 1909 Marsh Ln
- 1108 Harmony Dr
- 2000 Jamestown Ct
- 2003 Jamestown Ct
- 1910 Marsh Ln
Your Personal Tour Guide
Ask me questions while you tour the home.