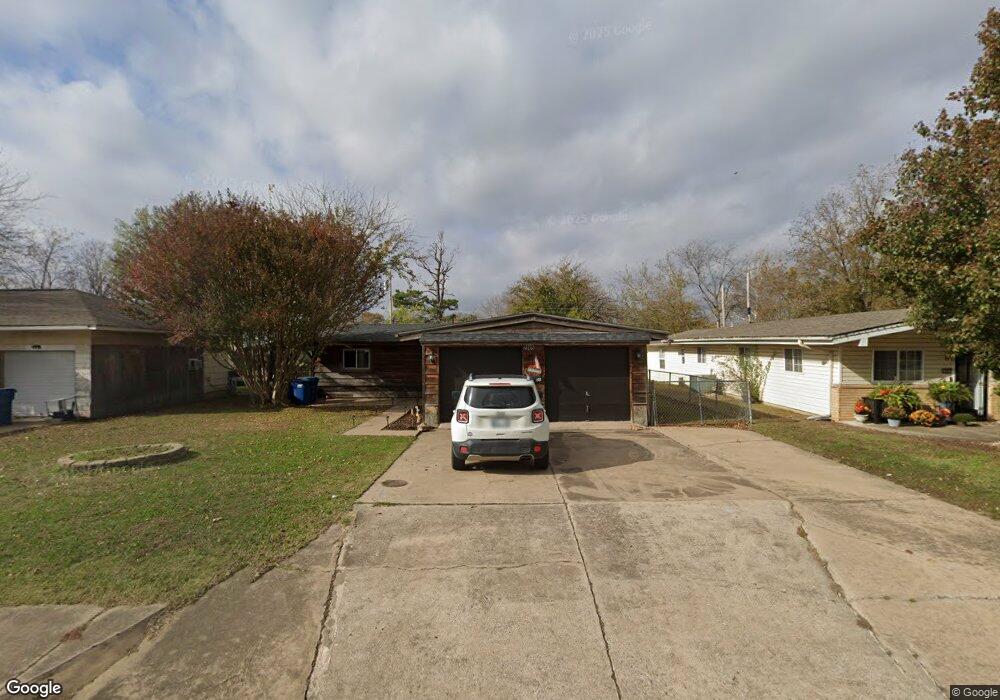
2005 N A St McAlester, OK 74501
Estimated Value: $88,000 - $105,000
3
Beds
3
Baths
1,164
Sq Ft
$83/Sq Ft
Est. Value
About This Home
This home is located at 2005 N A St, McAlester, OK 74501 and is currently estimated at $96,719, approximately $83 per square foot. 2005 N A St is a home located in Pittsburg County with nearby schools including McAlester High School, Mcalester Christian Academy, and McAlester Christian Academy.
Ownership History
Date
Name
Owned For
Owner Type
Purchase Details
Closed on
Oct 25, 2023
Sold by
Herandy Kali Lou and Herandy Christopher
Bought by
Heskett Donna Kay and Heskett Terry Lynn
Current Estimated Value
Purchase Details
Closed on
Aug 29, 2012
Sold by
Burke Matthew and Burke Matthew Garrett
Bought by
Hensley Kali and Hensley Billy
Home Financials for this Owner
Home Financials are based on the most recent Mortgage that was taken out on this home.
Original Mortgage
$64,728
Interest Rate
3.59%
Mortgage Type
New Conventional
Purchase Details
Closed on
Dec 18, 2006
Sold by
Warnock Clinton L and Warnock Clinton
Bought by
Burke Matthew and Shields Amber
Home Financials for this Owner
Home Financials are based on the most recent Mortgage that was taken out on this home.
Original Mortgage
$68,350
Interest Rate
6.31%
Mortgage Type
New Conventional
Create a Home Valuation Report for This Property
The Home Valuation Report is an in-depth analysis detailing your home's value as well as a comparison with similar homes in the area
Home Values in the Area
Average Home Value in this Area
Purchase History
| Date | Buyer | Sale Price | Title Company |
|---|---|---|---|
| Heskett Donna Kay | $80,000 | Fidelity National Title | |
| Heskett Donna Kay | $80,000 | Fidelity National Title | |
| Hensley Kali | $72,000 | None Available | |
| Burke Matthew | $69,500 | None Available |
Source: Public Records
Mortgage History
| Date | Status | Borrower | Loan Amount |
|---|---|---|---|
| Previous Owner | Pulchny Christopher Blake | $230,000 | |
| Previous Owner | Hensley Kali | $64,728 | |
| Previous Owner | Burke Matthew | $68,350 |
Source: Public Records
Tax History Compared to Growth
Tax History
| Year | Tax Paid | Tax Assessment Tax Assessment Total Assessment is a certain percentage of the fair market value that is determined by local assessors to be the total taxable value of land and additions on the property. | Land | Improvement |
|---|---|---|---|---|
| 2024 | $772 | $8,800 | $1,089 | $7,711 |
| 2023 | $772 | $8,428 | $1,089 | $7,339 |
| 2022 | $629 | $8,183 | $1,089 | $7,094 |
| 2021 | $625 | $8,183 | $1,089 | $7,094 |
| 2020 | $588 | $7,713 | $1,089 | $6,624 |
| 2019 | $523 | $7,713 | $1,089 | $6,624 |
| 2018 | $506 | $7,270 | $1,089 | $6,181 |
| 2017 | $494 | $7,058 | $1,089 | $5,969 |
| 2016 | $491 | $7,058 | $1,089 | $5,969 |
| 2015 | $515 | $7,920 | $407 | $7,513 |
| 2014 | $515 | $7,920 | $407 | $7,513 |
Source: Public Records
Map
Nearby Homes