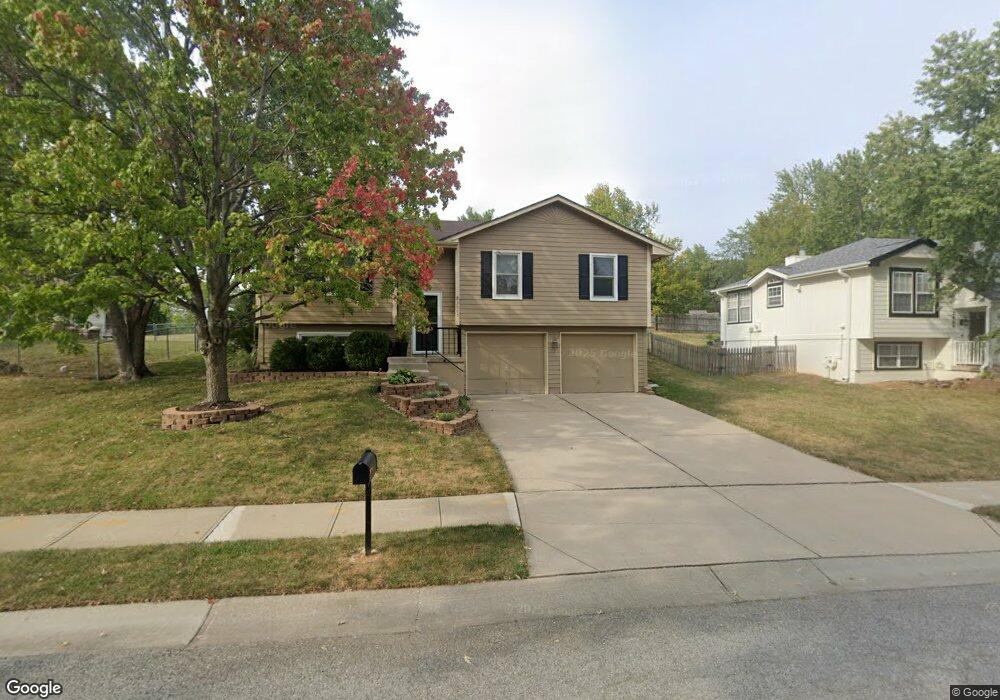
2005 NE Wien Ave Blue Springs, MO 64029
Estimated Value: $263,208 - $285,000
3
Beds
2
Baths
1,132
Sq Ft
$245/Sq Ft
Est. Value
About This Home
This home is located at 2005 NE Wien Ave, Blue Springs, MO 64029 and is currently estimated at $276,802, approximately $244 per square foot. 2005 NE Wien Ave is a home located in Jackson County with nearby schools including Grain Valley High School and St John Lalande School.
Ownership History
Date
Name
Owned For
Owner Type
Purchase Details
Closed on
Aug 14, 2009
Sold by
The Secretary Of Veterans Affairs
Bought by
Bozeman Carrie and Bozeman Marcie
Current Estimated Value
Home Financials for this Owner
Home Financials are based on the most recent Mortgage that was taken out on this home.
Original Mortgage
$115,862
Outstanding Balance
$75,466
Interest Rate
5.19%
Mortgage Type
FHA
Estimated Equity
$201,336
Purchase Details
Closed on
May 26, 2009
Sold by
Smith Carol A and Smith Robert Lance
Bought by
Secretary Of Veterans Affairs
Purchase Details
Closed on
Sep 21, 2006
Sold by
Dunaway Bradley A and Dunaway Melissa D
Bought by
Smith Robert Lance and Smith Carol A
Home Financials for this Owner
Home Financials are based on the most recent Mortgage that was taken out on this home.
Original Mortgage
$134,000
Interest Rate
6.51%
Mortgage Type
VA
Purchase Details
Closed on
Dec 17, 2002
Sold by
Pope Ricky Eugene and Pope Jody J
Bought by
Dunaway Bradley A and Dunaway Melissa D
Home Financials for this Owner
Home Financials are based on the most recent Mortgage that was taken out on this home.
Original Mortgage
$124,440
Interest Rate
6.05%
Mortgage Type
VA
Create a Home Valuation Report for This Property
The Home Valuation Report is an in-depth analysis detailing your home's value as well as a comparison with similar homes in the area
Home Values in the Area
Average Home Value in this Area
Purchase History
| Date | Buyer | Sale Price | Title Company |
|---|---|---|---|
| Bozeman Carrie | $118,000 | First American Title | |
| Secretary Of Veterans Affairs | $110,162 | Continental Title Company | |
| Smith Robert Lance | -- | Metro One Title | |
| Dunaway Bradley A | -- | Chicago Title |
Source: Public Records
Mortgage History
| Date | Status | Borrower | Loan Amount |
|---|---|---|---|
| Open | Bozeman Carrie | $115,862 | |
| Previous Owner | Smith Robert Lance | $134,000 | |
| Previous Owner | Dunaway Bradley A | $124,440 |
Source: Public Records
Tax History Compared to Growth
Tax History
| Year | Tax Paid | Tax Assessment Tax Assessment Total Assessment is a certain percentage of the fair market value that is determined by local assessors to be the total taxable value of land and additions on the property. | Land | Improvement |
|---|---|---|---|---|
| 2025 | $2,479 | $36,686 | $6,067 | $30,619 |
| 2024 | $2,383 | $32,083 | $4,860 | $27,223 |
| 2023 | $2,383 | $32,084 | $3,692 | $28,392 |
| 2022 | $2,289 | $27,740 | $4,303 | $23,437 |
| 2021 | $2,230 | $27,740 | $4,303 | $23,437 |
| 2020 | $2,240 | $27,796 | $4,303 | $23,493 |
| 2019 | $2,179 | $27,796 | $4,303 | $23,493 |
| 2018 | $2,032 | $24,191 | $3,745 | $20,446 |
| 2017 | $1,967 | $24,191 | $3,745 | $20,446 |
| 2016 | $1,967 | $23,408 | $3,876 | $19,532 |
| 2014 | $1,838 | $21,654 | $3,868 | $17,786 |
Source: Public Records
Map
Nearby Homes
- 2104 NE Wyndham Place
- 1855 NE Duncan Rd
- 2372 NE Colonnade Ave
- 2237 NE Maybrook Dr
- 2340 NE Colonnade Ave
- 2344 NE Colonnade Ave
- 2210 NE Treetop Dr
- 2341 NE Colonnade Ave
- 2345 NE Colonnade Ave
- 2352 NE Colonnade Ave
- 2400 NE Porter Rd
- 2353 NE Colonnade Ave
- 2309 NE 23rd St
- 2304 NE 23rd St
- 2360 NE Colonnade Ave
- 2369 NE Colonnade Ave
- 2373 NE Colonnade Ave
- 2367 NE Skopelos Ct
- 2376 NE Skopelos Ct
- 2332 NE Andromada Ct
- 2005 NE Wien Ave Unit BEDROOM 2B - 651485
- 2009 NE Wien Ave
- 2015 NE Wien Ave Unit BEDROOM 1B - 651482
- 2015 NE Wien Ave Unit BEDROOM 2D - 651488
- 2805 NE Wien Avenue Bedroom 2d
- 1600 NE 20th St
- 2013 NE Wien Ave
- 2004 NE Village Ct
- 2008 NE Village Ct
- 2008 NE Wien Ave
- 1512 NE 20th St
- 2085 NE Wien Avenue Bedroom 1a
- 2012 NE Wien Ave
- 1608 NE 20th St
- 1601 NE 20th St
- 1506 NE 20th St
- 1605 NE 20th St
- 1920 NE Wien Ave
- 2012 NE Village Ct
- 1609 NE 20th St