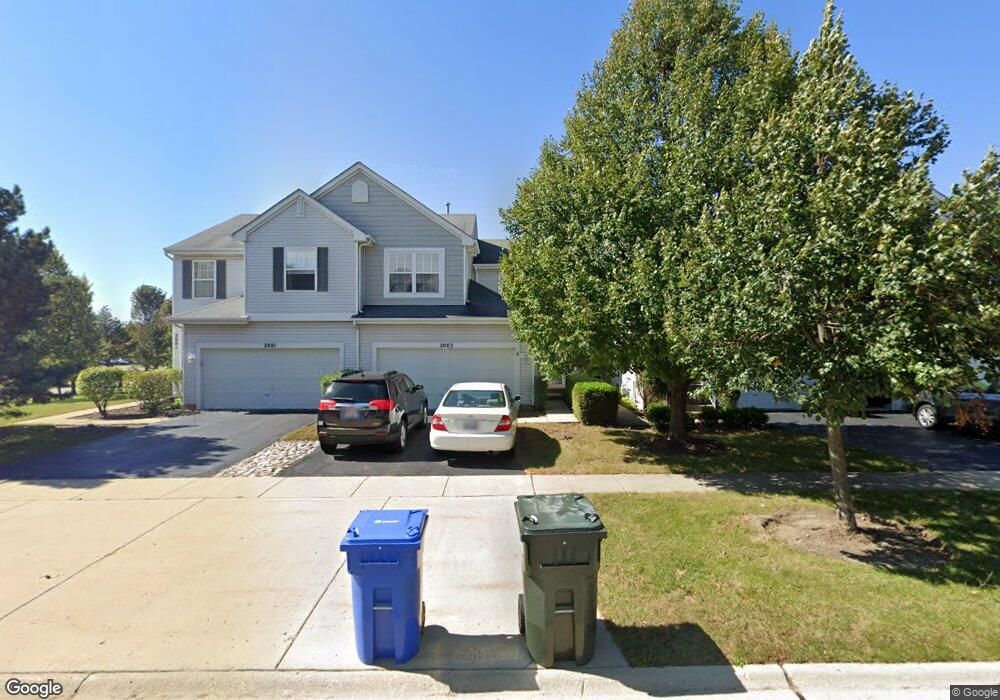
2005 Orchard Ln Unit 1C4 Carpentersville, IL 60110
Estimated Value: $237,346 - $254,000
2
Beds
2
Baths
1,007
Sq Ft
$245/Sq Ft
Est. Value
About This Home
This home is located at 2005 Orchard Ln Unit 1C4, Carpentersville, IL 60110 and is currently estimated at $246,587, approximately $244 per square foot. 2005 Orchard Ln Unit 1C4 is a home located in Kane County with nearby schools including Sleepy Hollow Elementary School, Dundee Middle School, and West Prairie Middle School.
Ownership History
Date
Name
Owned For
Owner Type
Purchase Details
Closed on
Oct 14, 2005
Sold by
Arcuri Anna
Bought by
Schroeder Cathy L
Current Estimated Value
Home Financials for this Owner
Home Financials are based on the most recent Mortgage that was taken out on this home.
Original Mortgage
$110,000
Outstanding Balance
$59,912
Interest Rate
6.04%
Mortgage Type
Fannie Mae Freddie Mac
Estimated Equity
$186,675
Purchase Details
Closed on
Jun 15, 2001
Sold by
Oscarson Gloria J
Bought by
Arcuri Anna
Home Financials for this Owner
Home Financials are based on the most recent Mortgage that was taken out on this home.
Original Mortgage
$108,000
Interest Rate
7.11%
Mortgage Type
Balloon
Purchase Details
Closed on
Aug 30, 1999
Sold by
Oak Brook Bank
Bought by
Oscarson Gloria J
Home Financials for this Owner
Home Financials are based on the most recent Mortgage that was taken out on this home.
Original Mortgage
$109,850
Interest Rate
6.5%
Create a Home Valuation Report for This Property
The Home Valuation Report is an in-depth analysis detailing your home's value as well as a comparison with similar homes in the area
Home Values in the Area
Average Home Value in this Area
Purchase History
| Date | Buyer | Sale Price | Title Company |
|---|---|---|---|
| Schroeder Cathy L | $173,000 | Atg Search | |
| Arcuri Anna | $135,000 | First American Title Ins Co | |
| Oscarson Gloria J | $123,000 | -- |
Source: Public Records
Mortgage History
| Date | Status | Borrower | Loan Amount |
|---|---|---|---|
| Open | Schroeder Cathy L | $110,000 | |
| Previous Owner | Arcuri Anna | $108,000 | |
| Previous Owner | Oscarson Gloria J | $109,850 |
Source: Public Records
Tax History Compared to Growth
Tax History
| Year | Tax Paid | Tax Assessment Tax Assessment Total Assessment is a certain percentage of the fair market value that is determined by local assessors to be the total taxable value of land and additions on the property. | Land | Improvement |
|---|---|---|---|---|
| 2024 | $4,645 | $69,336 | $8,371 | $60,965 |
| 2023 | $4,570 | $62,386 | $7,532 | $54,854 |
| 2022 | $4,184 | $54,056 | $7,532 | $46,524 |
| 2021 | $4,080 | $51,040 | $7,112 | $43,928 |
| 2020 | $4,010 | $49,892 | $6,952 | $42,940 |
| 2019 | $3,914 | $47,363 | $6,600 | $40,763 |
| 2018 | $3,012 | $36,351 | $6,469 | $29,882 |
| 2017 | $2,873 | $34,004 | $6,051 | $27,953 |
| 2016 | $2,962 | $32,924 | $5,859 | $27,065 |
| 2015 | -- | $29,547 | $5,490 | $24,057 |
| 2014 | -- | $28,731 | $5,338 | $23,393 |
| 2013 | -- | $31,861 | $5,501 | $26,360 |
Source: Public Records
Map
Nearby Homes
- 2052 Orchard Ln Unit 19C5
- 8022 Sierra Woods Ln Unit 8022
- 8304 Sierra Woods Ln Unit 8304
- 2809 Forestview Dr
- 36W690 Winding Trail
- 17N431 Oak Knoll Ln
- 2843 Forestview Dr
- 6850 Huntley Rd
- lot 009 Huntley Rd
- 3121 Drury Ln
- 235 Settlers Place
- 36W461 Binnie Rd
- 36W340 Huntley Rd
- 205 Settlers Place
- 201 Settlers Place
- 207 Settlers Place
- 245 Settlers Place
- 241 Settlers Place
- 243 Settlers Place
- 209 Settlers Place
- 2007 Orchard Ln Unit 1D3
- 2009 Orchard Ln Unit 1B5
- 2003 Orchard Ln Unit 1A2
- 2001 Orchard Ln Unit 1B1
- 1604 Gleneagle Dr
- 1606 Gleneagle Dr Unit 1
- 2013 Orchard Ln Unit 2A2
- 2017 Orchard Ln Unit 2D3
- 2019 Orchard Ln Unit 2B5
- 2015 Orchard Ln Unit 2C4
- 1602 Gleneagle Dr
- 2011 Orchard Ln Unit 2B1
- 1612 Gleneagle Dr
- 2036 Orchard Ln Unit 21B1
- 2034 Orchard Ln Unit 21A2
- 2032 Orchard Ln Unit 21A3
- 2026 Orchard Ln
- 2030 Orchard Ln Unit 21A4
- 2028 Orchard Ln
- 2046 Orchard Ln Unit 20A2